
Fleet accidents aren’t just stats on a page, they can indicate lives lost, drivers hurt, and families impacted.
For managers in transport, delivery, construction, mining, and farming, these numbers aren’t just reports, they’re daily reminders of the responsibility behind every roster, every truck check, and every route planned.
This article breaks down the latest fleet accident statistics in Australia (2025) including fatalities, hospitalisations, costs, and causes. This will explain how managers can turn this data into safer practices, stronger compliance, and smoother operations.
Counting the Cost: Fatality Trends in Australia’s Heavy Vehicle Industry
The numbers paint a clear picture:
According to the National Road Safety Data Hub (to March 2025):
BITRE data to September 2024 shows similar results:
Encouraging signs, but the reality is, even one fatality is one too many. A falling national average won’t protect your fleet if your own numbers aren’t improving.
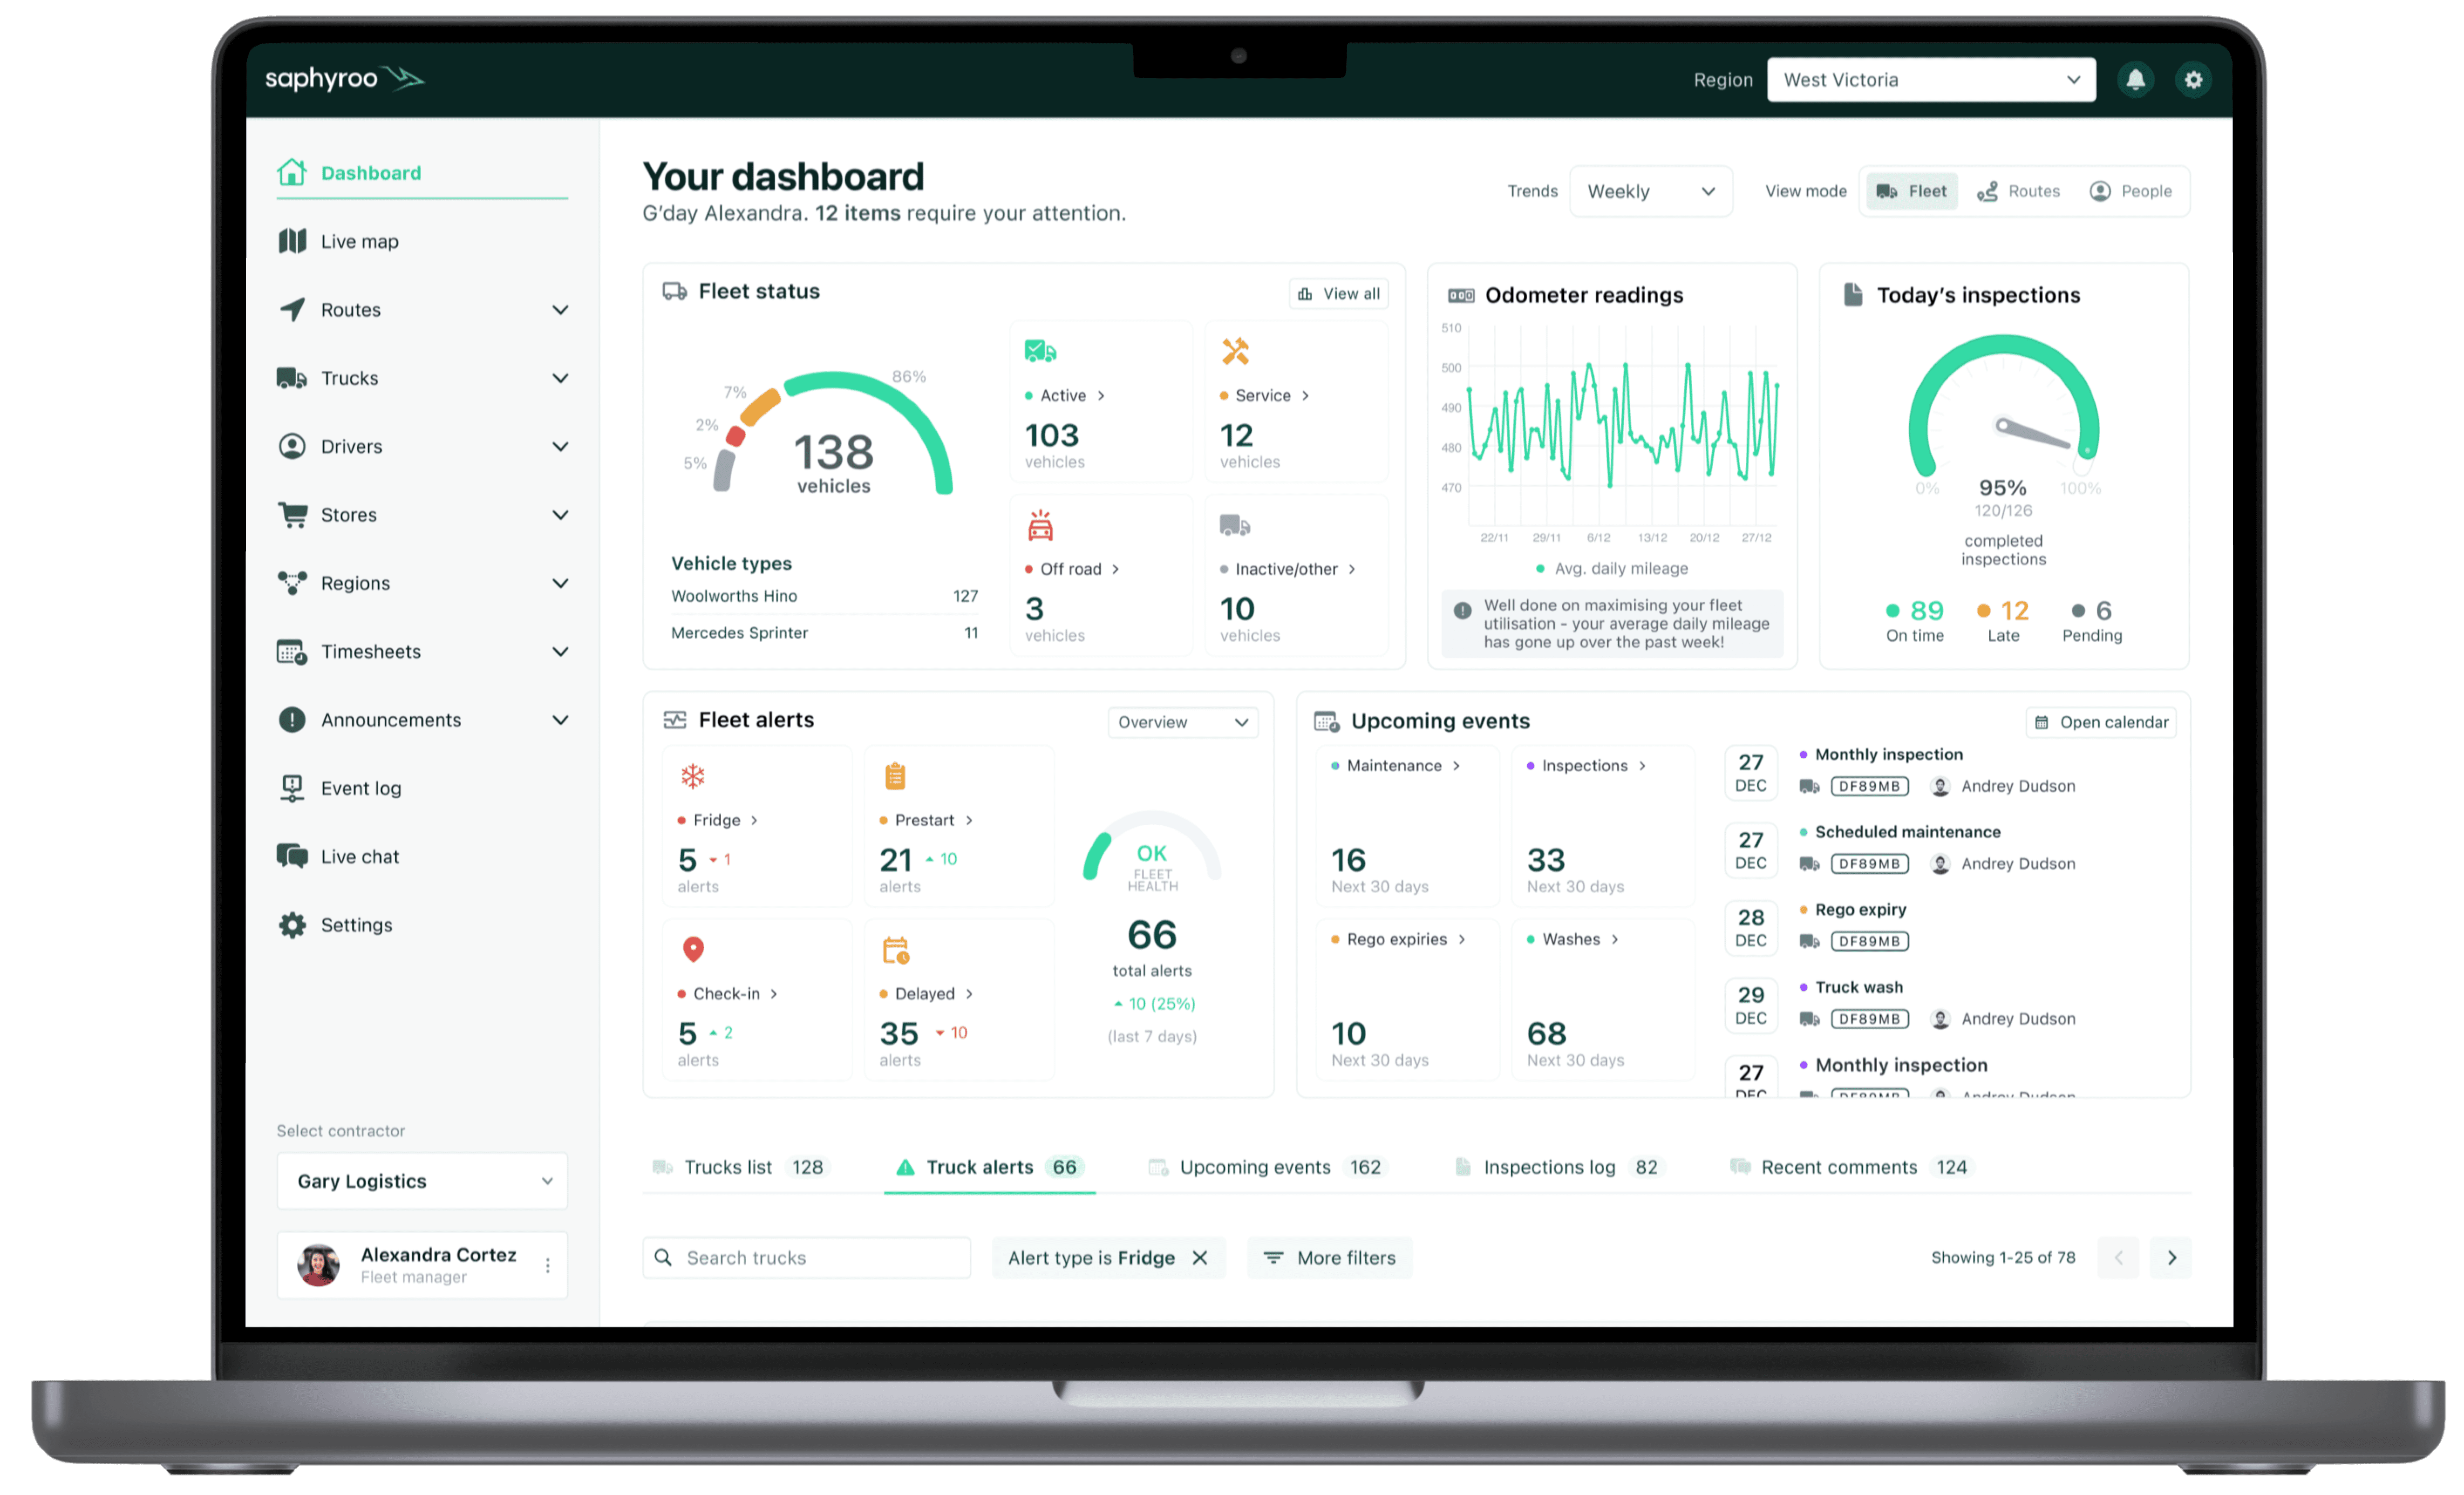
Technology is playing a big part in bringing heavy vehicle fatality numbers down, and tools like Saphyroo are leading the way.
The Vision360 AI cameras pick up signs of fatigue or distraction in real time and alert drivers before it turns into an incident.
The Drive360 App makes it simple for drivers to log fatigue or safety concerns without paperwork, while the Drive360 Console ensures rosters can’t be published if they break NHVR rules.
Then by adding in EWD integration for audit-ready records, managers have live visibility of risks across the fleet.
Together, these features help turn compliance from a paperwork exercise into a proactive system that protects drivers and keeps fleets safer on the road.
The stats are improving, make sure your fleet is too!
Hospitalisations Show the Real Cost of Fleet Accidents
Fatalities are only part of the picture, it’s the injuries that tell the longer story. A serious injury can turn life upside down for a driver, their family, and the business they work for.
The Australian Institute of Health and Welfare (AIHW) reports:
Transport was the third leading cause of injury hospitalisations in 2023 -24.
Even when a driver walks away from a crash, time off for recovery often stretches into weeks or months, leaving gaps in the roster. That means bringing in new people, extra training, piles of paperwork from insurers, and a hit to productivity.
The greatest cost of any crash is always the lives lost or drivers injured. But beyond the human toll, the financial impact can be huge:
Common Causes of Fleet Accidents: Fatigue, Distraction & Speed
The National Truck Accident Research Centre (NTARC) and other studies identify recurring patterns:
Common mistakes managers shouldn't overlook:
Turning Road Stats into Real Safety
Collecting stats is the easy part. Turning them into action is what makes the difference.
Daily Fleet Safety Checklist (Don’t / Do):
❌ Don’t assign shifts without rest checks.
✅ Do monitor fatigue risks before rostering.
❌ Don’t ignore minor bumps.
✅ Do record near misses to spot patterns.
❌ Don’t leave inspections on paper.
✅ Do use digital logs with photo evidence.
❌ Don’t assume costs end with repairs.
✅ Do factor in downtime, insurance, and client trust.
National statistics should be used as a benchmark. If fatigue is the top national cause, make fatigue your fleet’s top priority. If distraction is rising, consider in cab alerts or driver coaching sessions.
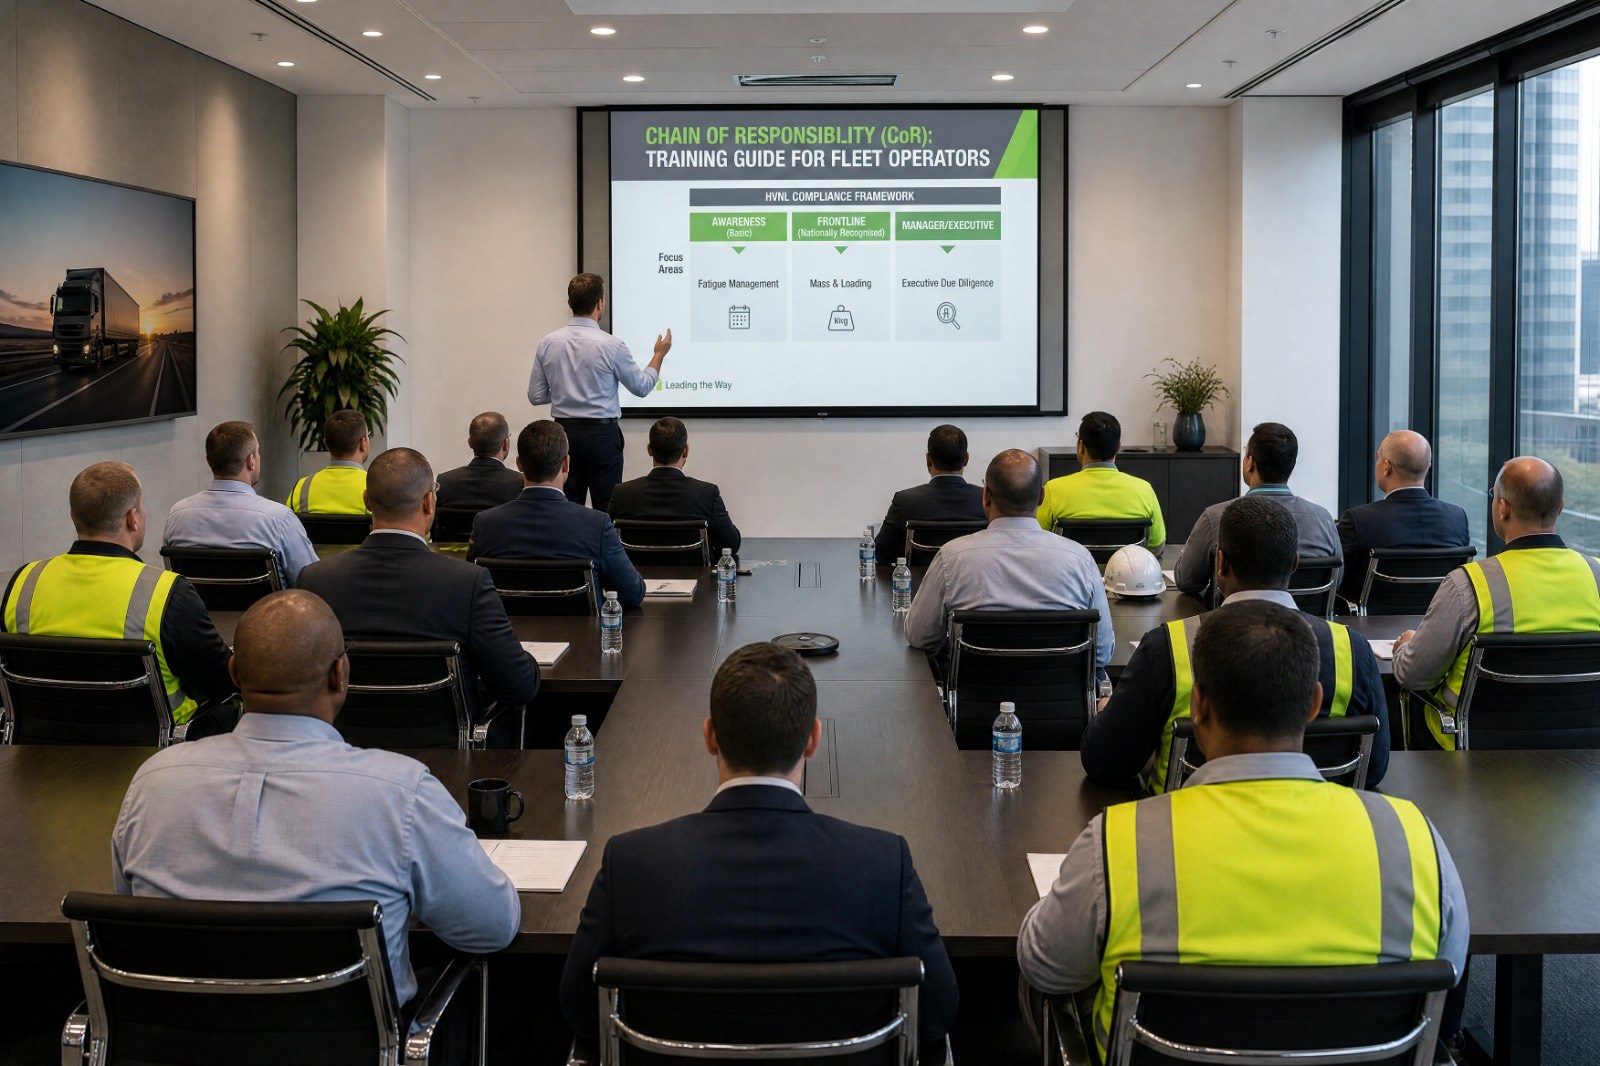
NHVR Compliance and Chain of Responsibility: What the Stats Demand
The NHVR and Chain of Responsibility (CoR) laws make it clear, safety isn’t optional. In transport, the blame doesn’t just land on the driver. If fatigue or weak systems cause a crash, everyone including the owners, schedulers, managers are responsible.
Accident stats aren’t just background data, they link directly to your compliance responsibilities.
Because fatigue plays a role in about 1 in 10 serious truck crashes, the NHVR (National Heavy Vehicle Regulator) expects operators to actively manage it.
The NHVR isn’t satisfied with assurances, they require clear evidence that fatigue risks are being properly managed.
If you’ve got clear fatigue logs and incident reports ready in an audit, you’re showing you’re on top of it and that can cut your liability.
The Overall Picture:
The 2025 fleet accident data shows progress, but also some urgent reminders:
Stats aren’t just numbers, they’re your roadmap to a safer, stronger fleet. Use the data, benchmark, fix the gaps, and keep drivers safe. Accident stats are more than reports, they’re your call to action. Safer fleets start with smarter data.
When managers use accident data to strengthen their systems, they’re not just meeting compliance, they're protecting lives, improving culture, and safeguarding the business for the long run.
If you’d like to see how real-time fatigue monitoring, inspection logging, and incident tracking could support your operation, book a demo today.