Route Performance & Analytics
Route Analytics That Make the Next Run Better
See how the day actually performed against the plan, understand where things changed and use what you learn to improve future routes.
- Compare planned and actual performance
- Track on time and time window results
- Identify delays, exceptions and trends
- Compare drivers, routes and depots
- Schedule reports for key recipients

THE ANALYTICS WORKSPACE
See Route Performance Across the Operation, Down to the Last Stop
Track performance across the operation and drill into the routes, drivers and stops that made the difference.
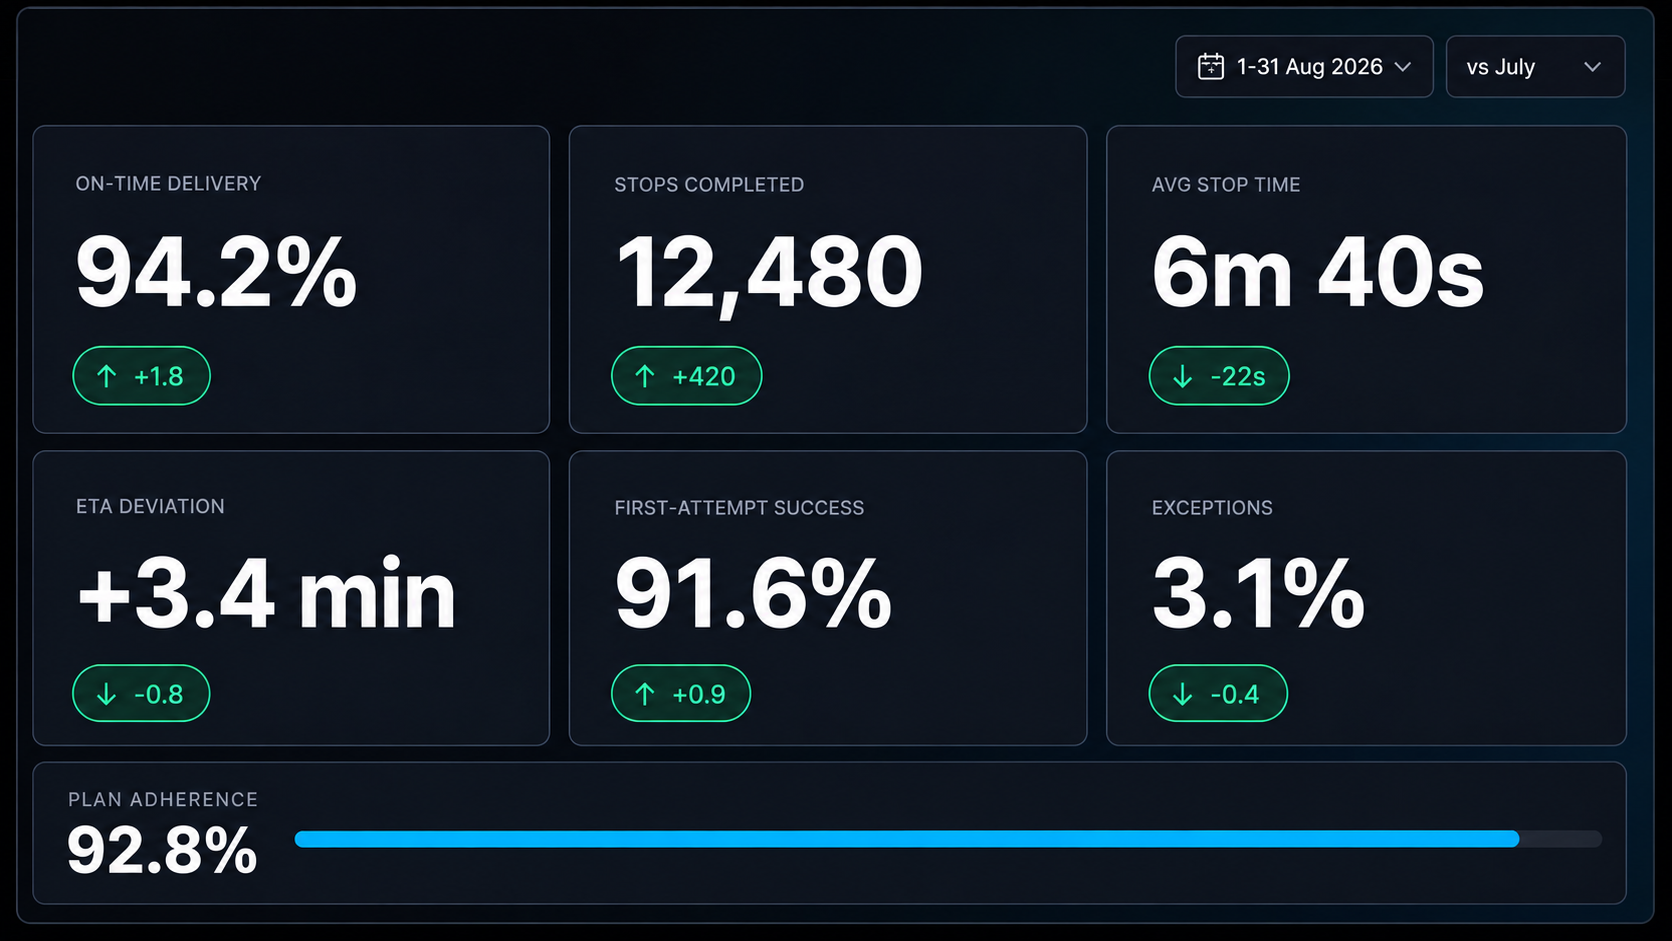
Turn Numbers into Insight.
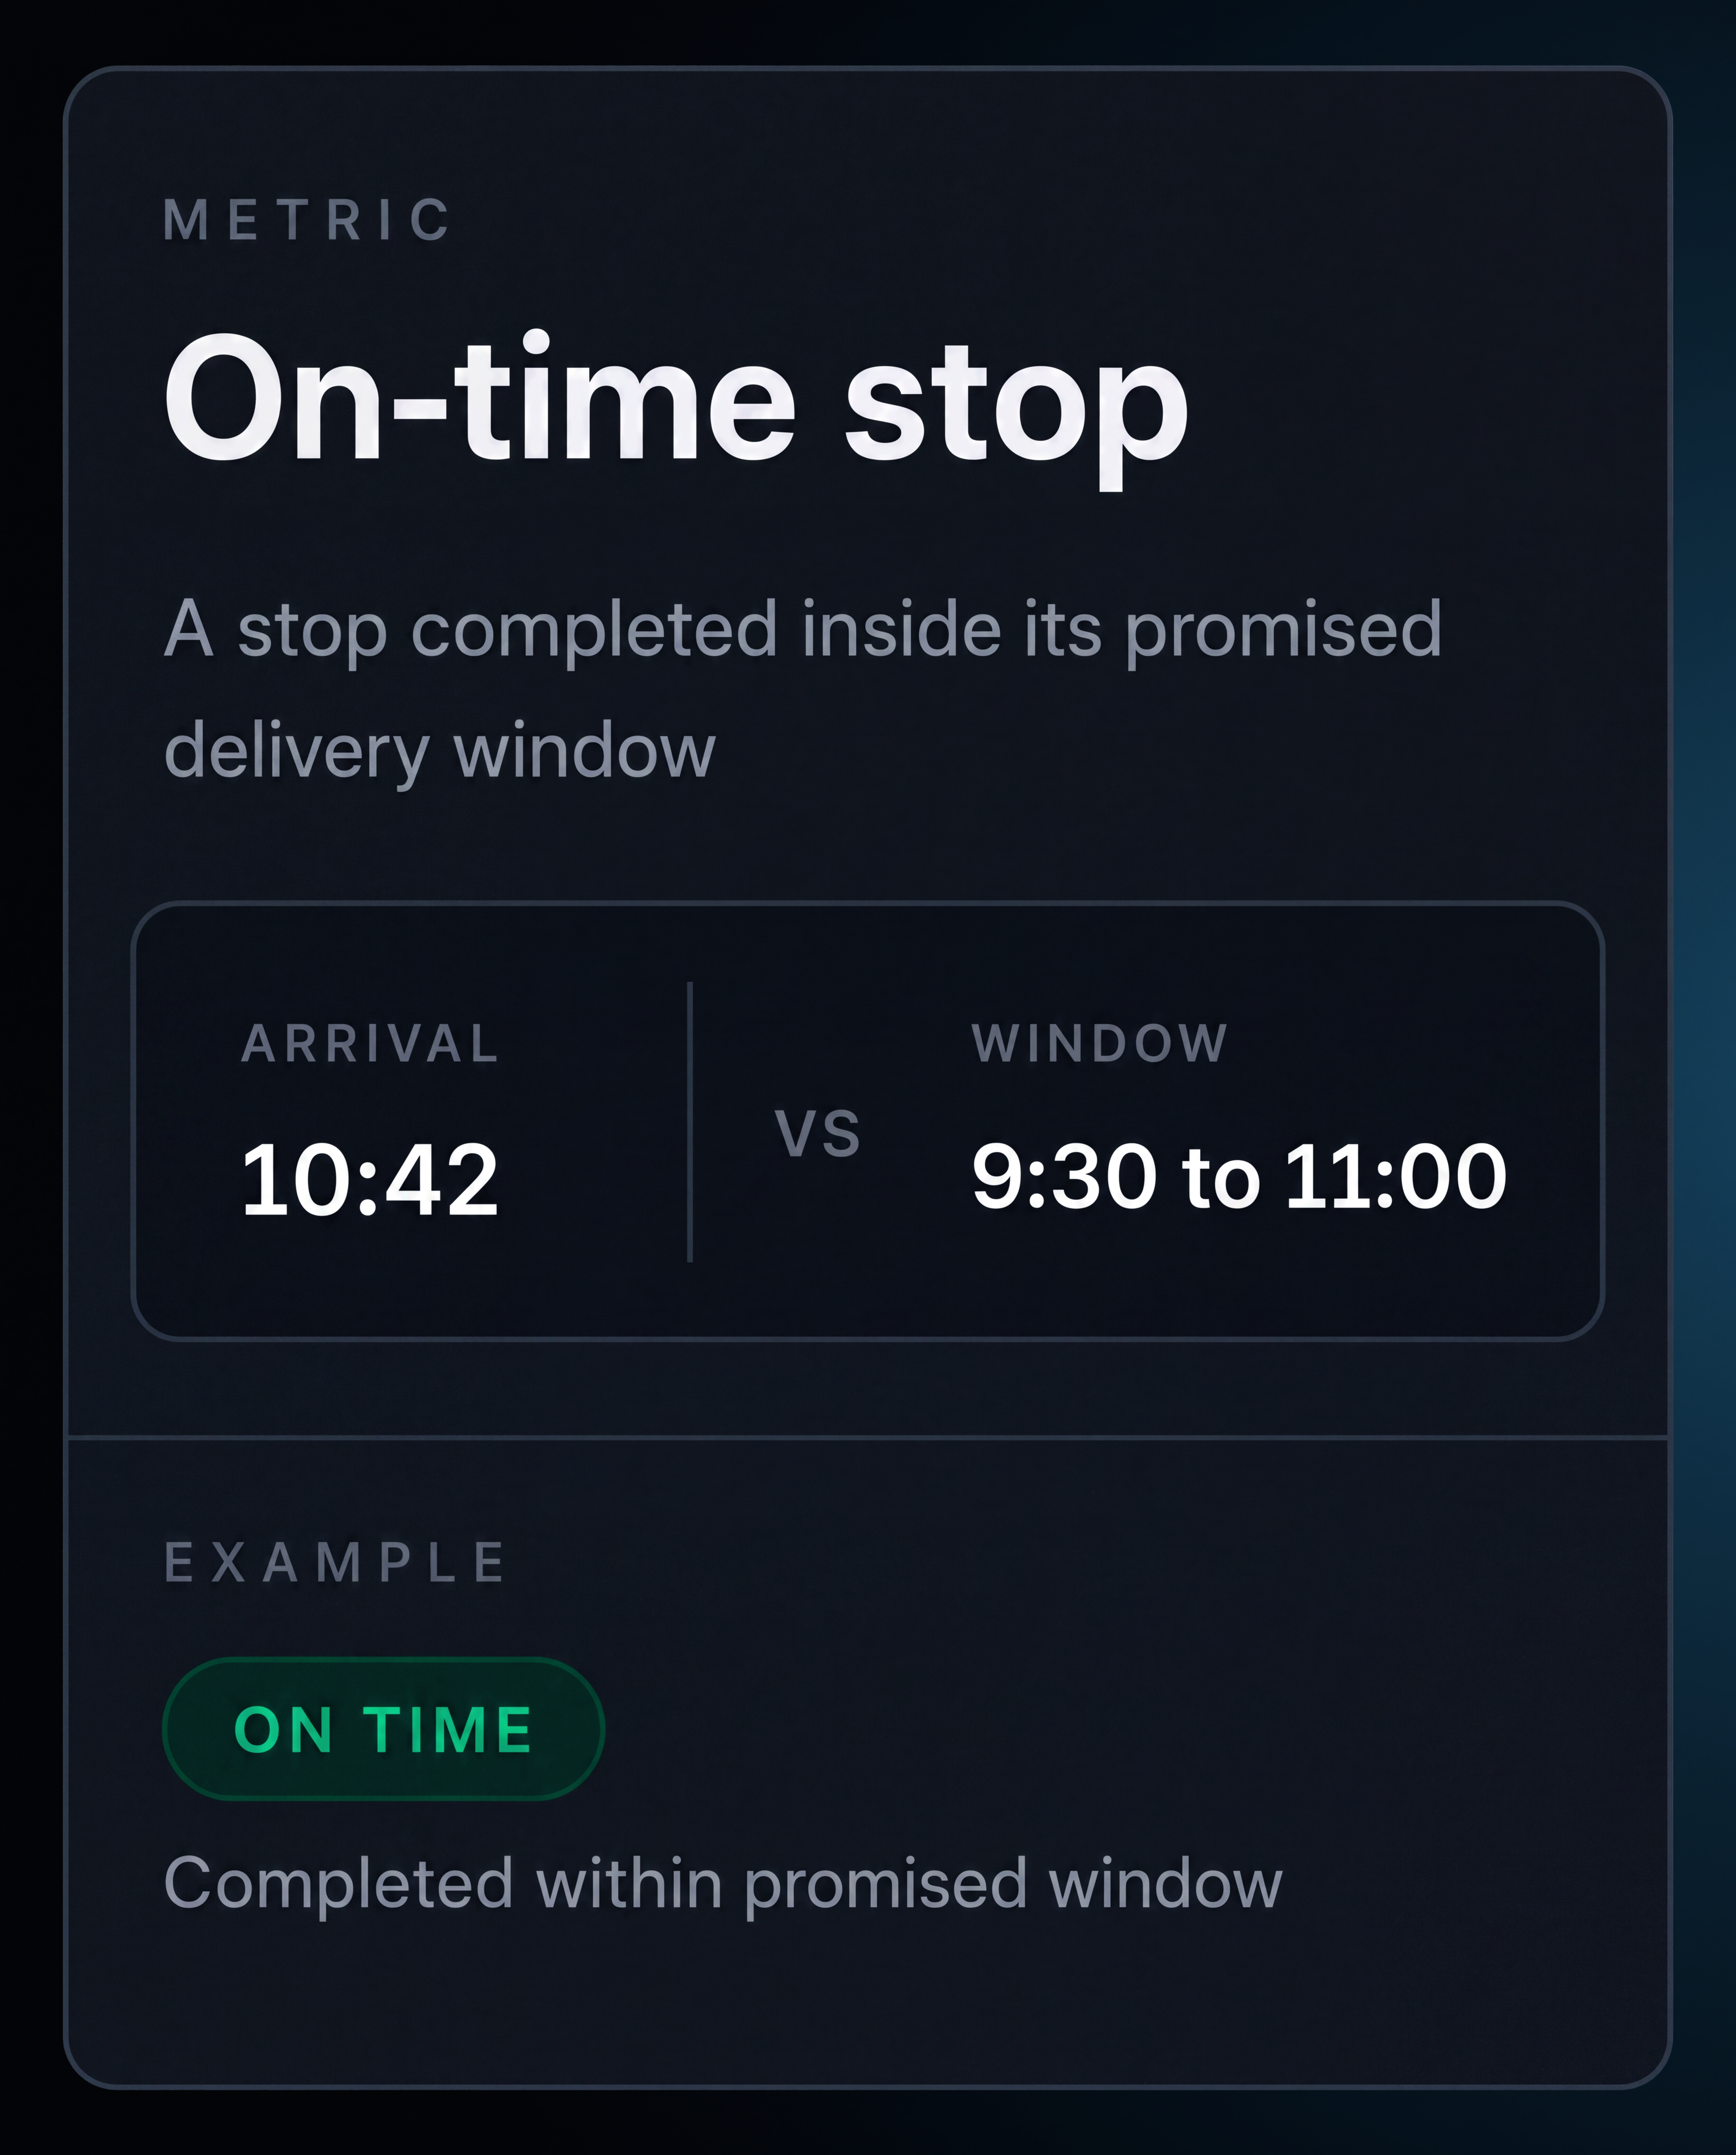
On time results. Arrived at or before the planned time, within your configured tolerance.
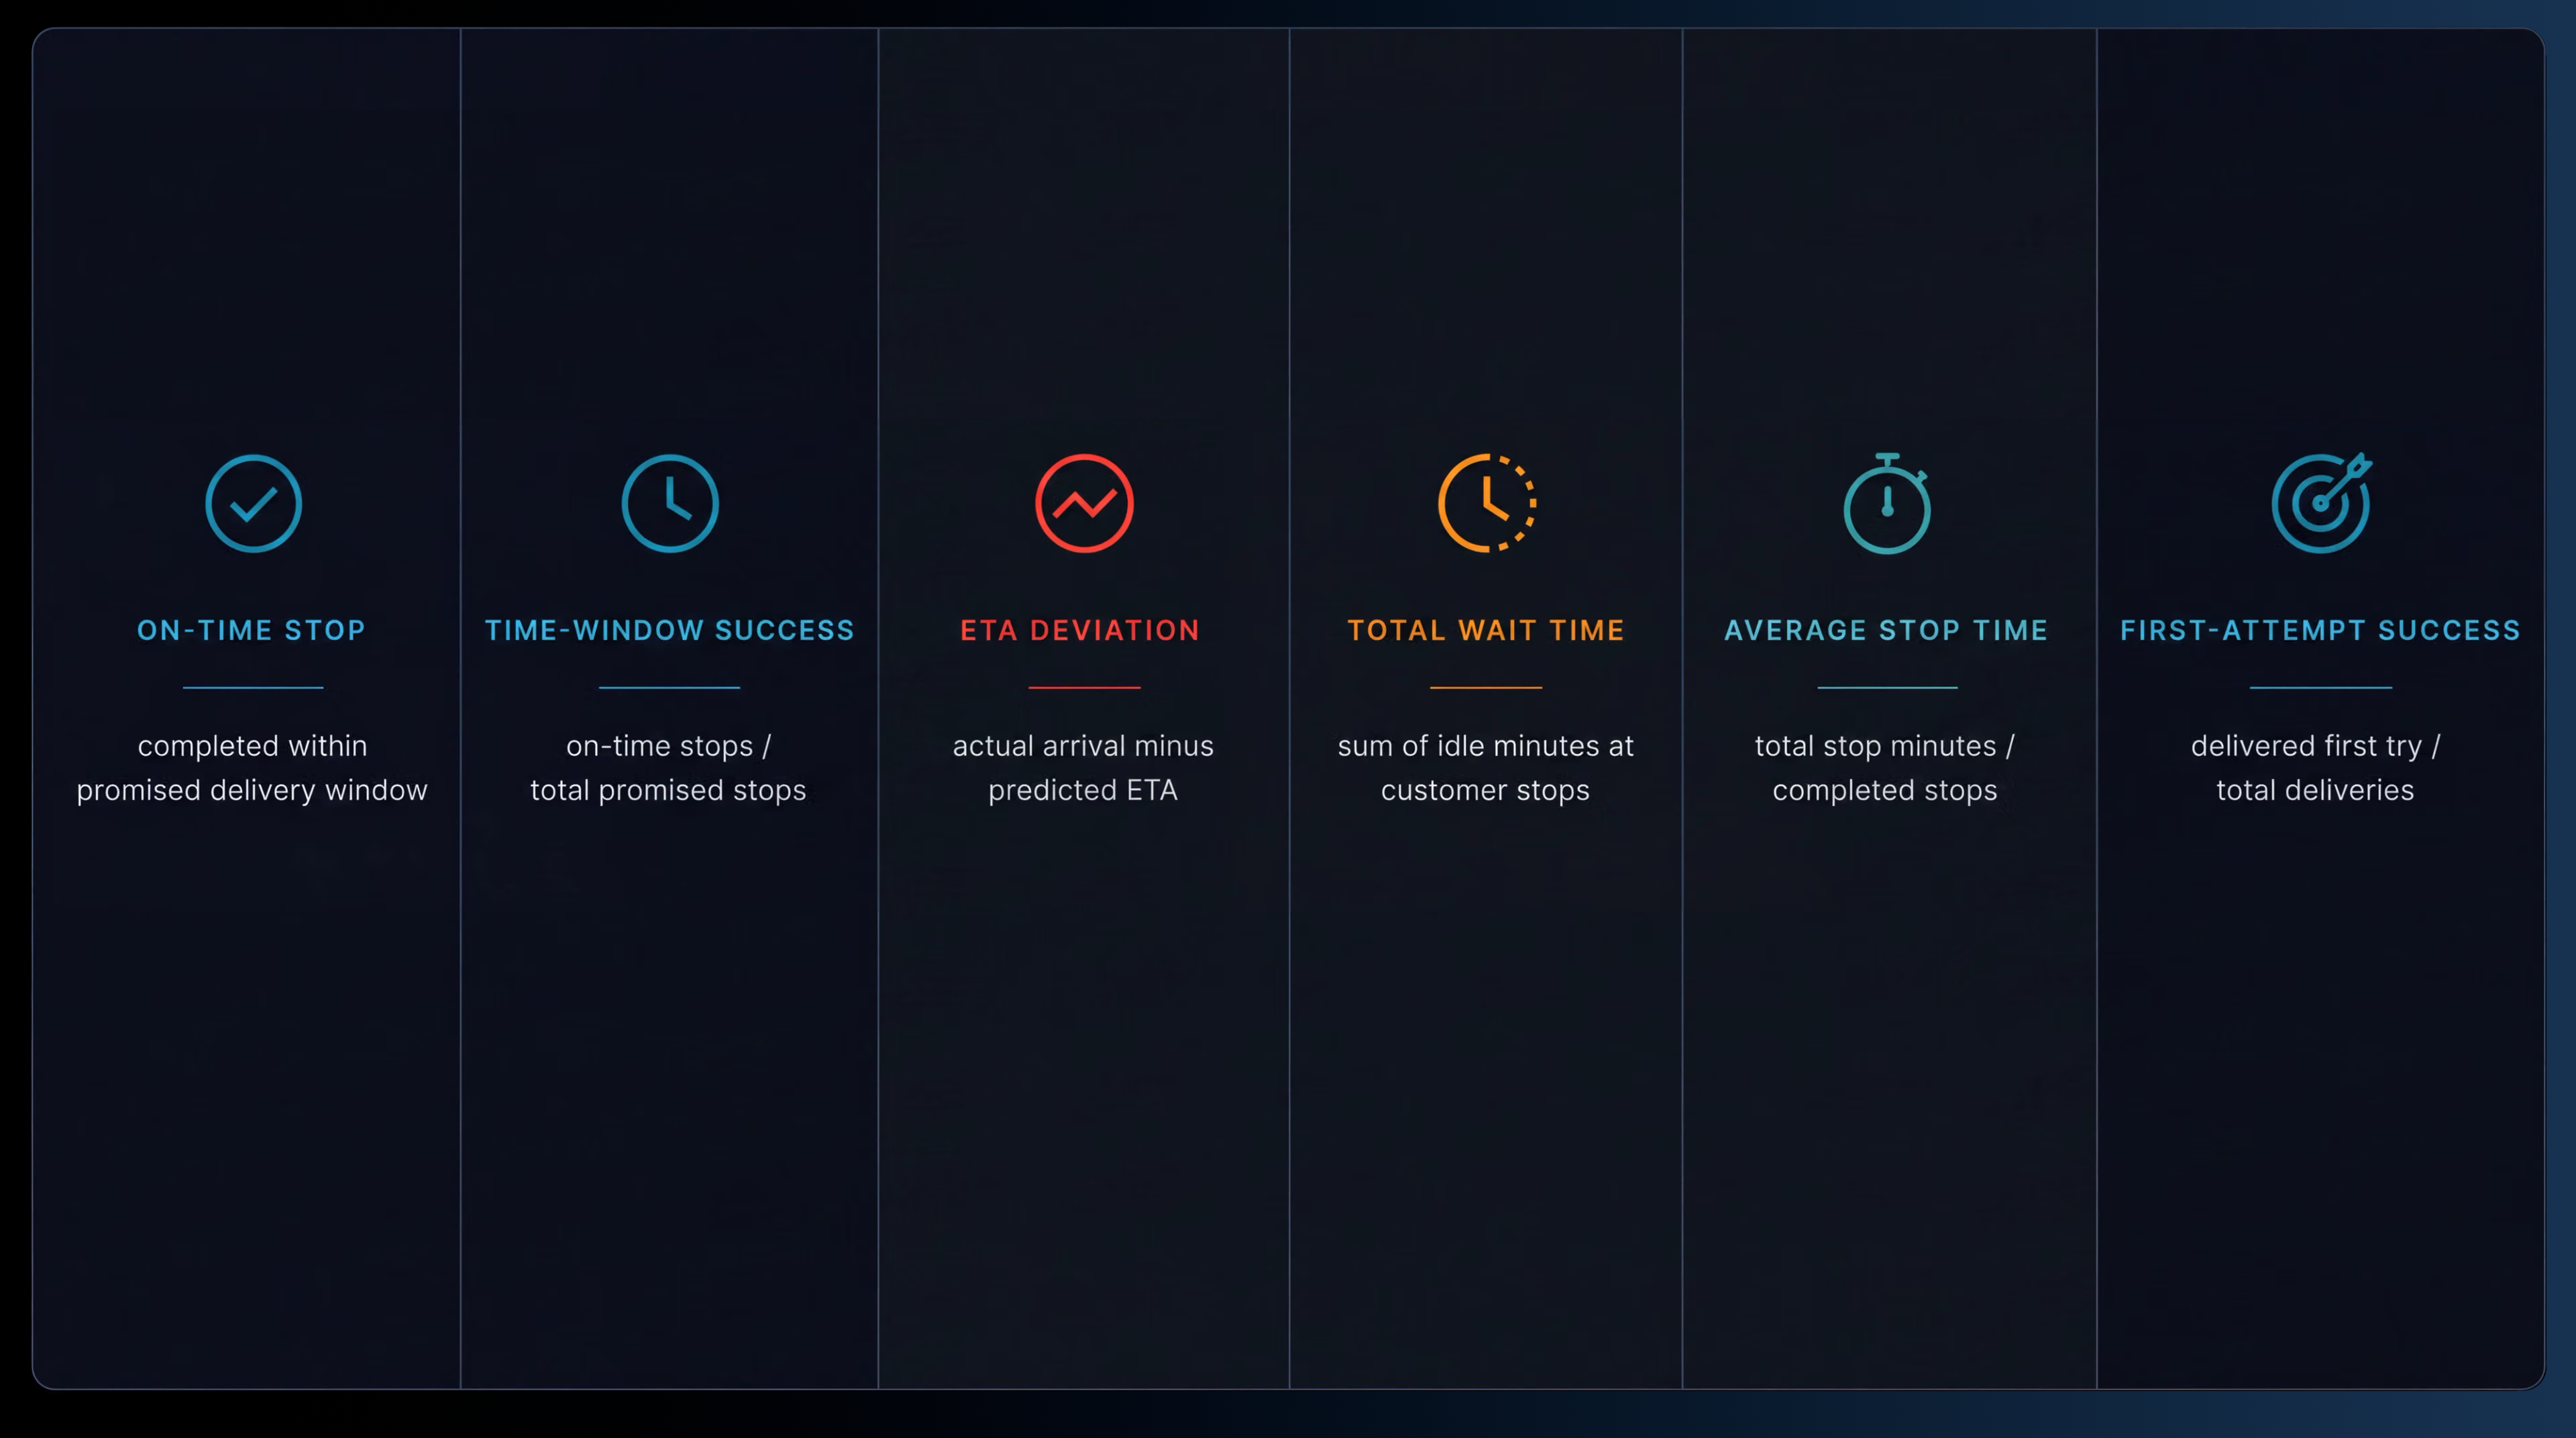
Metric definitions. Define on time stops, time window success, ETA deviation, average stop time, total wait time and exceptions where each metric appears.

Time window performance. Measure whether the stop was completed within the customer's delivery window.
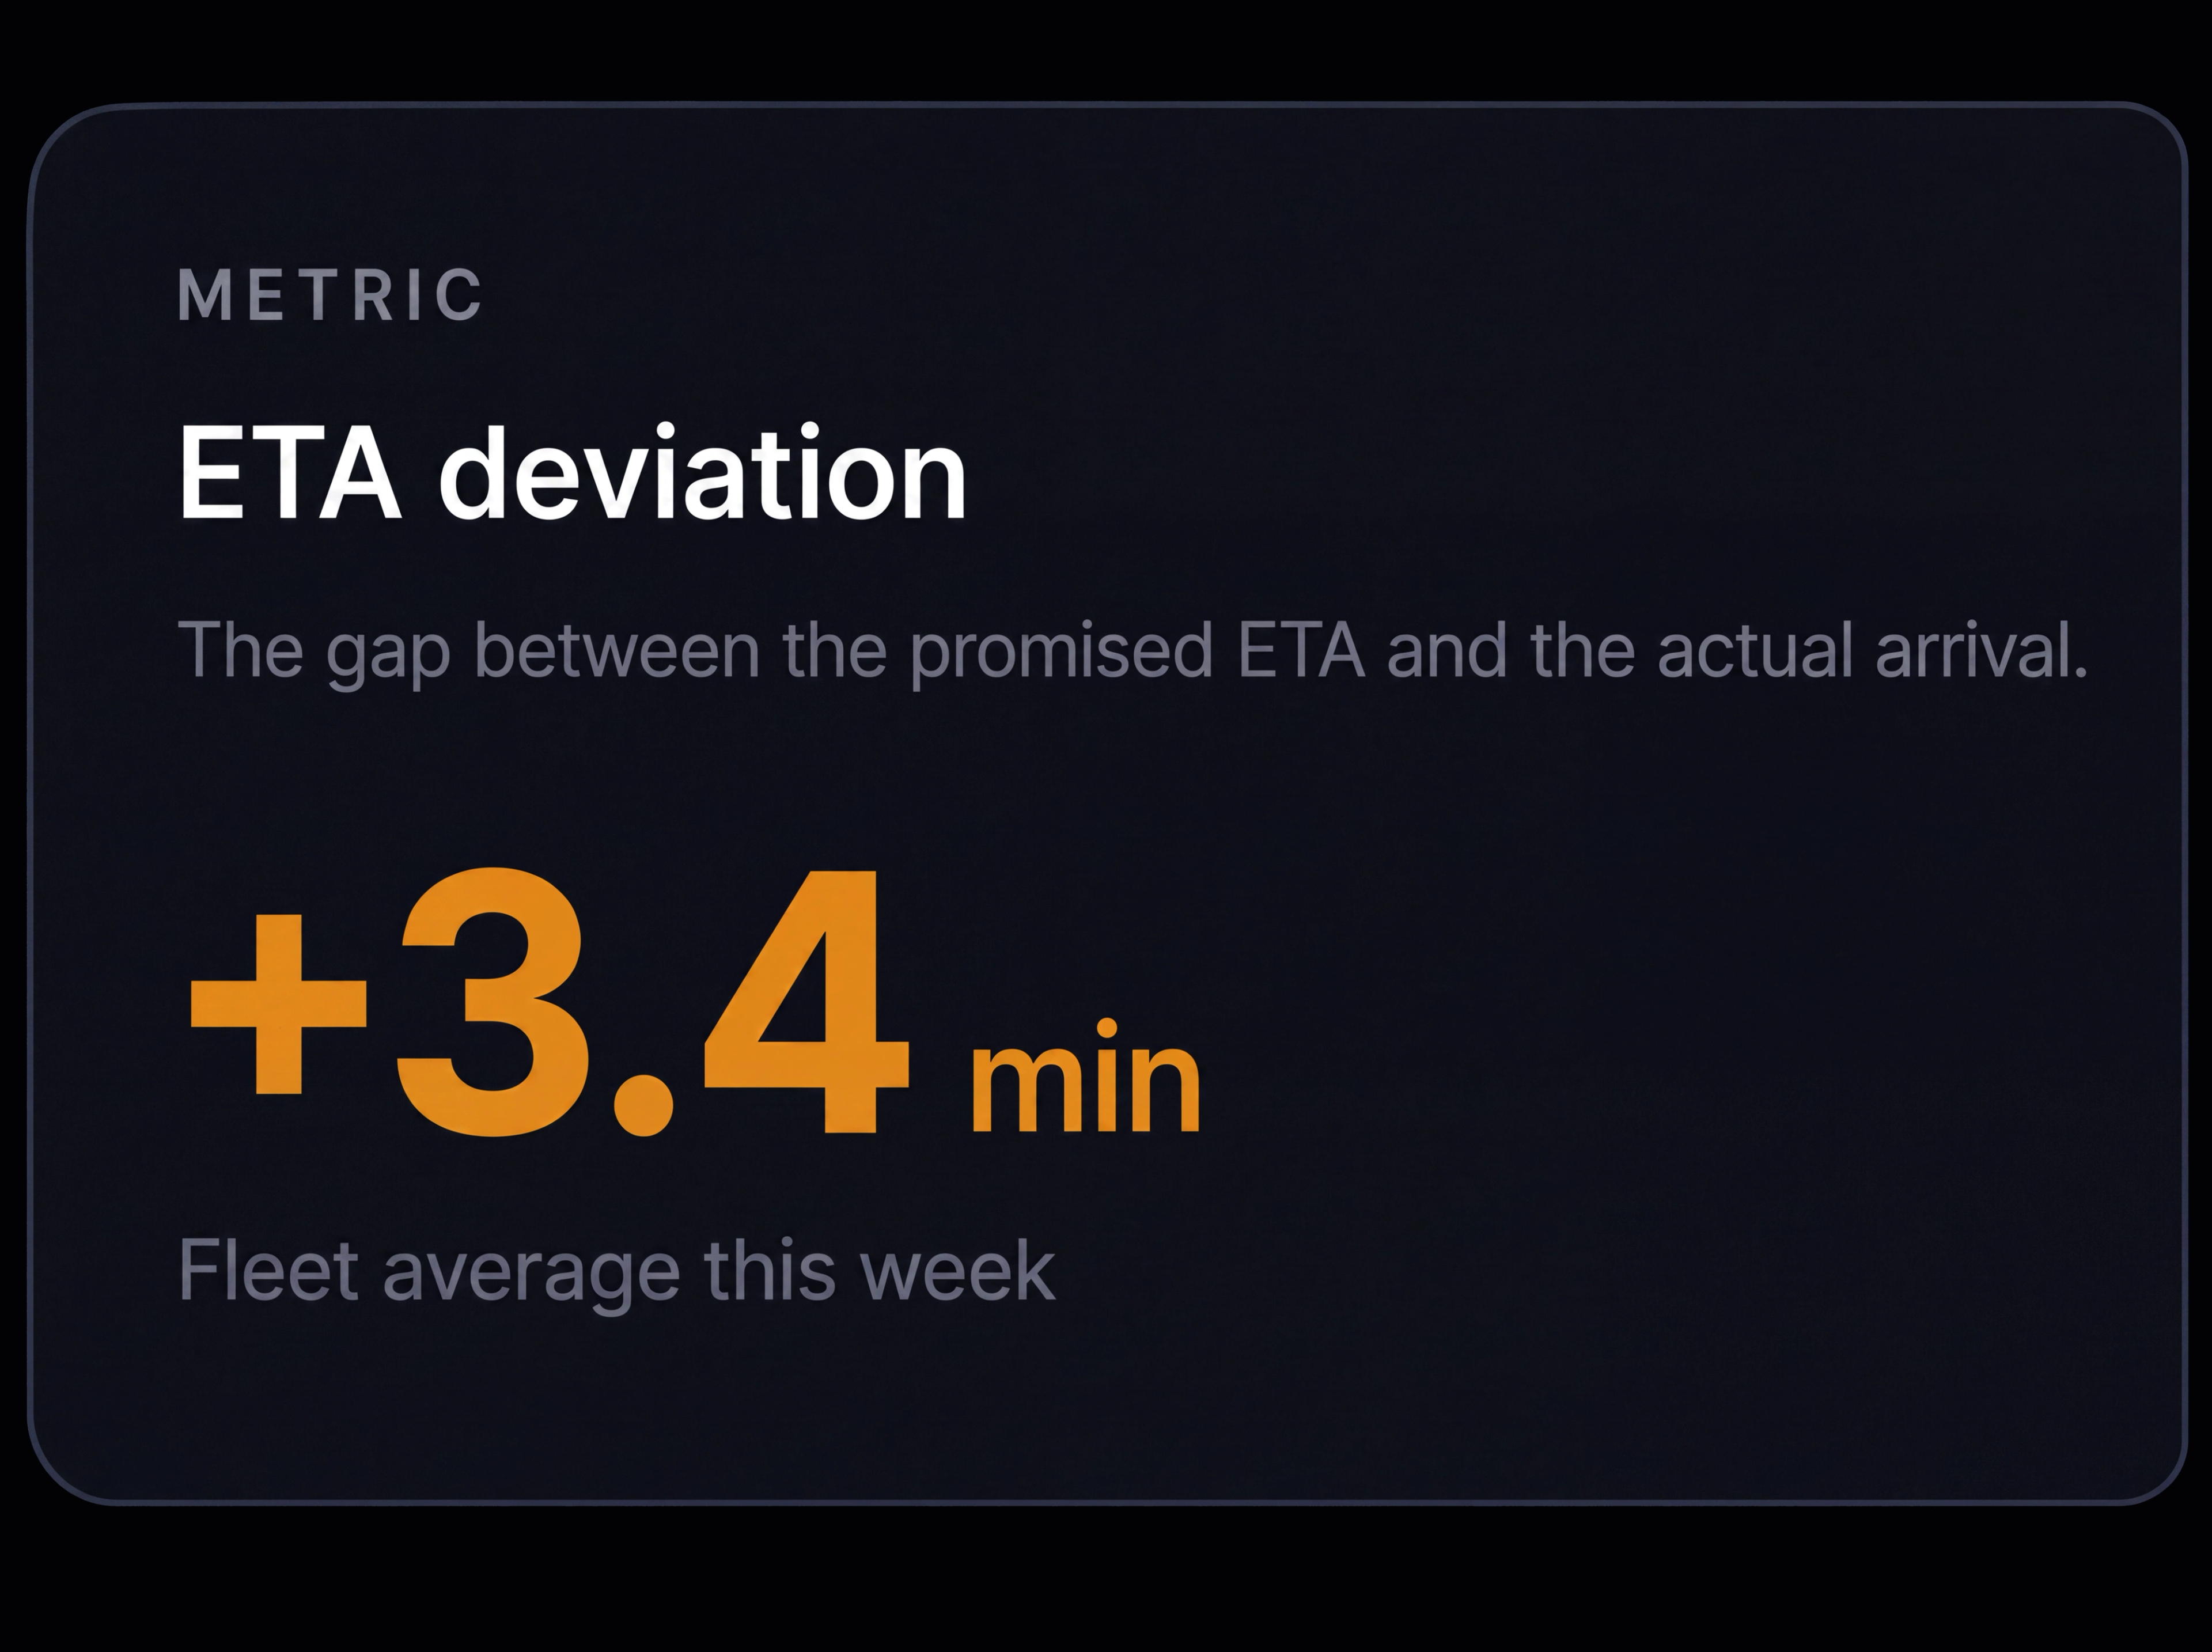
ETA deviation. Calculate the difference between actual and planned arrival time.

Total wait time. Measure time spent waiting on traffic, customers or other delays.

Report filters. Show the date range, depots, regions, drivers, vehicles and job types included in each result.
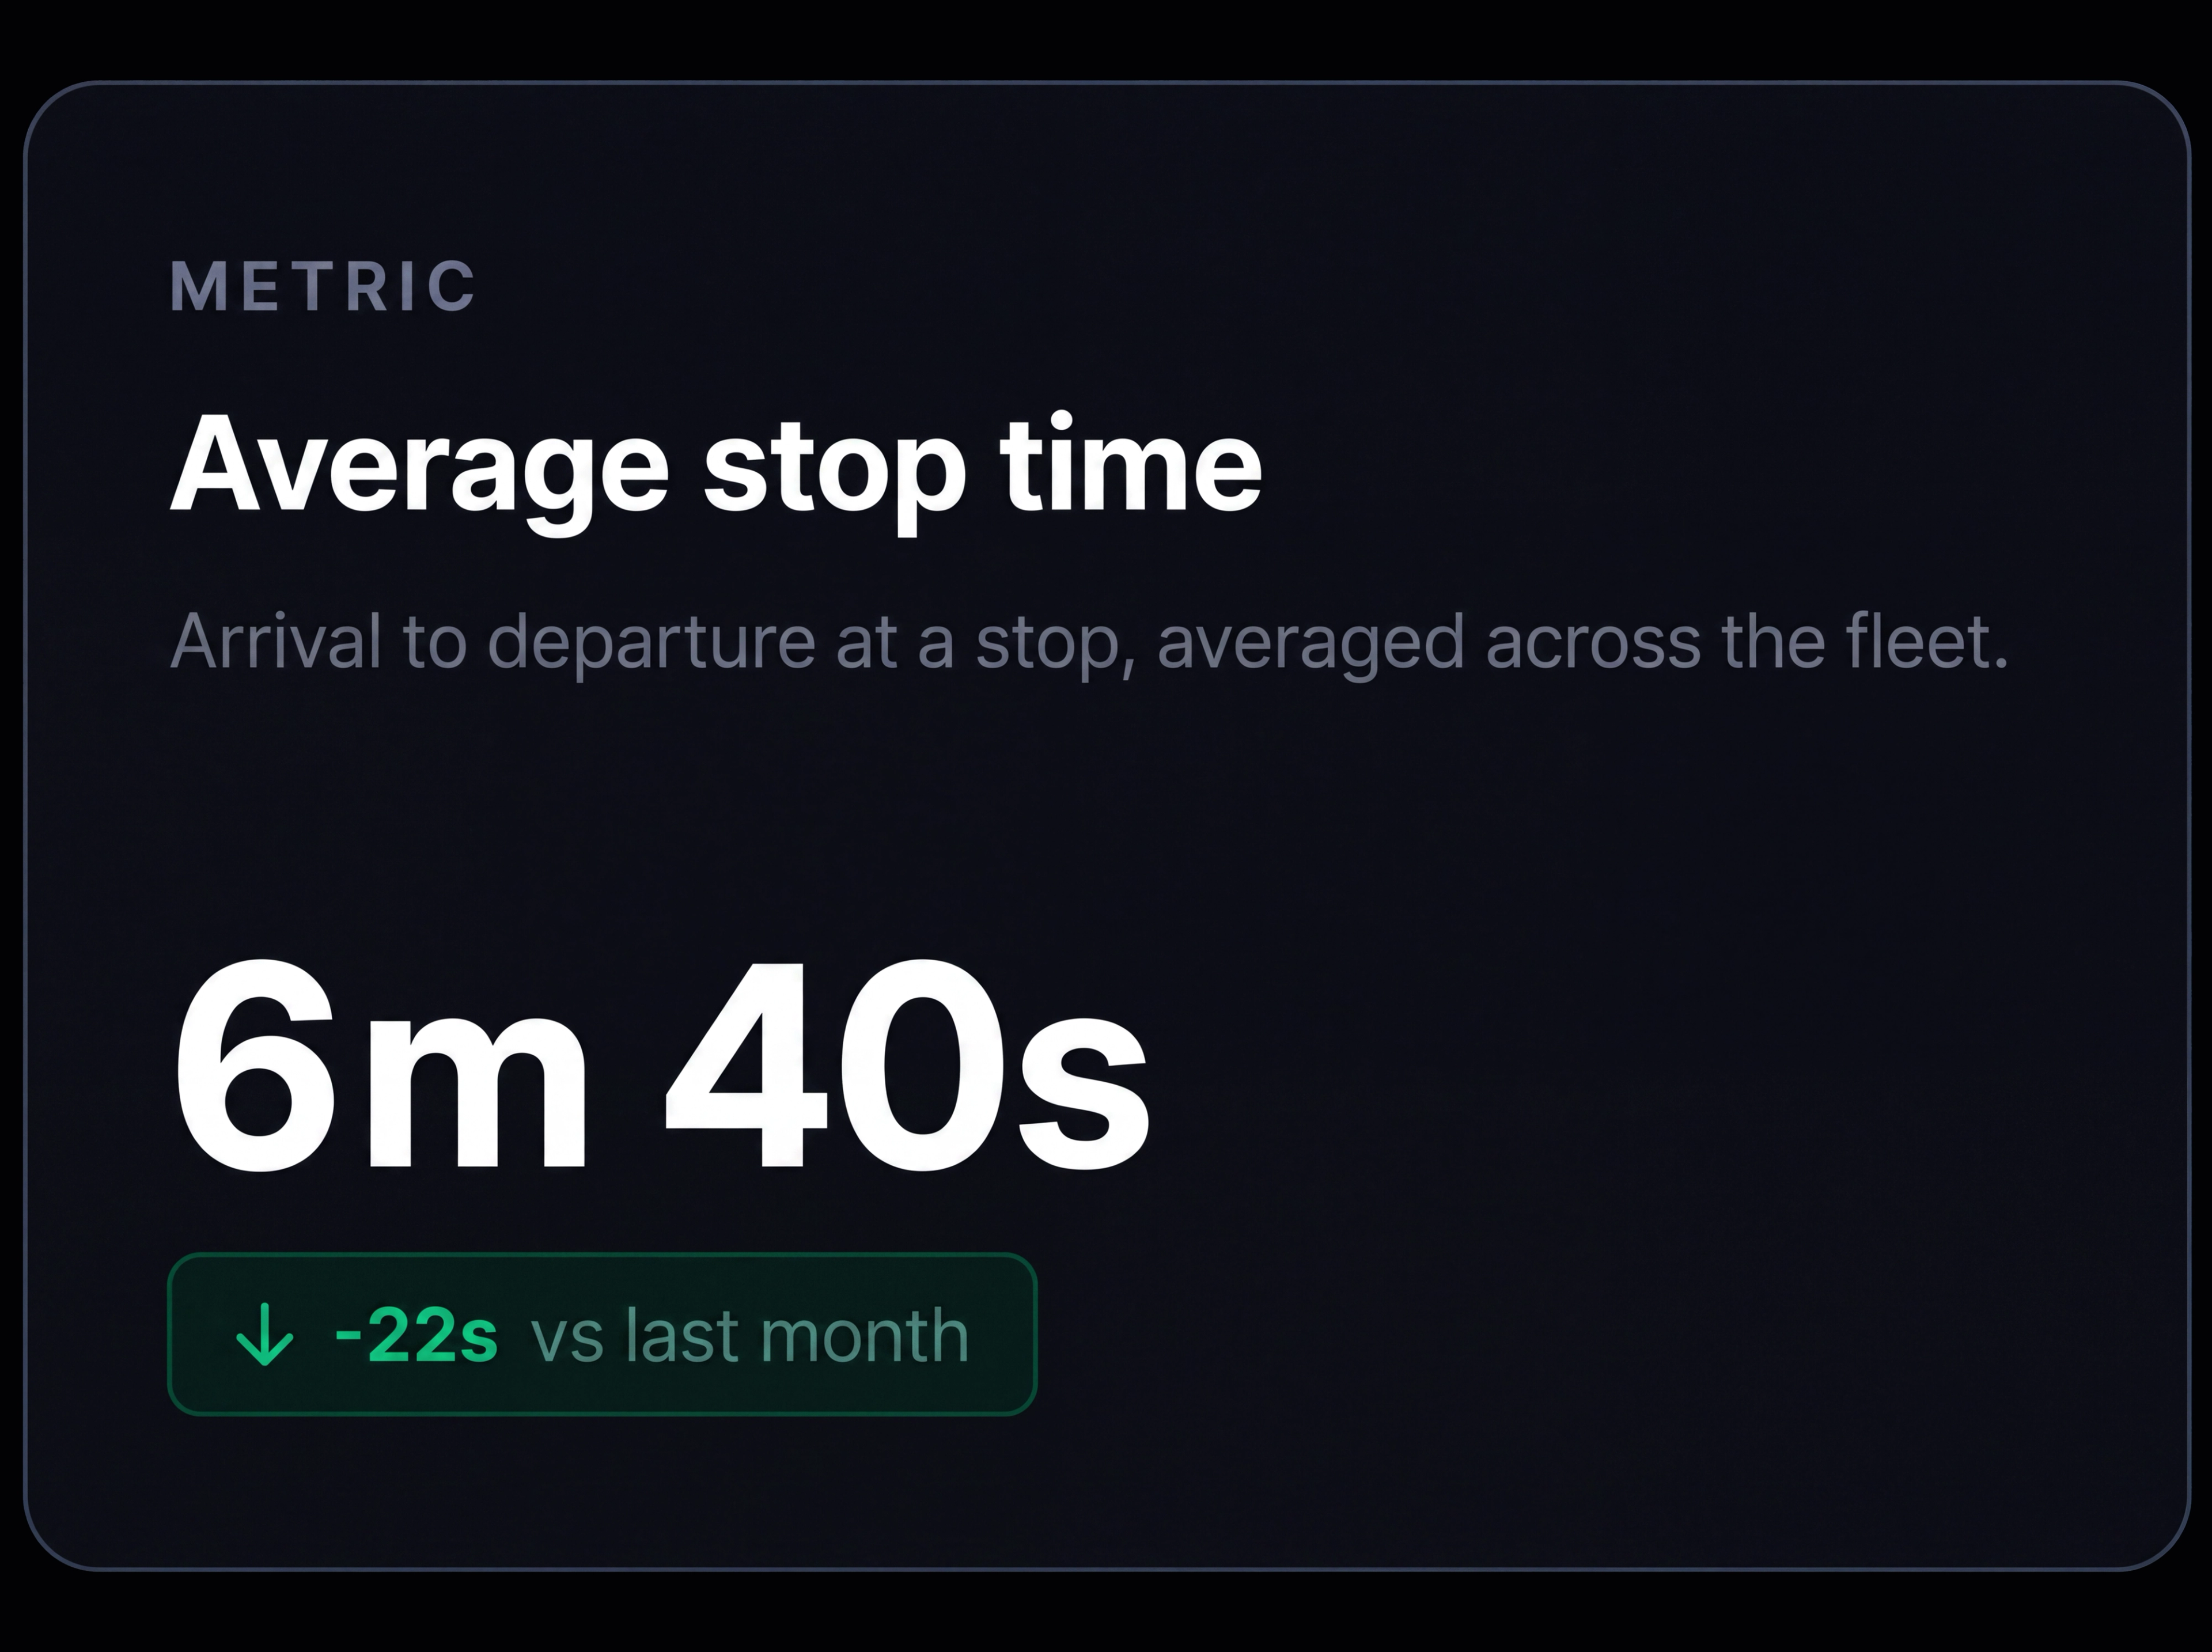
Average stop time. Measure total time spent at the stop, excluding travel time between stops.

From Fleet Performance to Individual Events
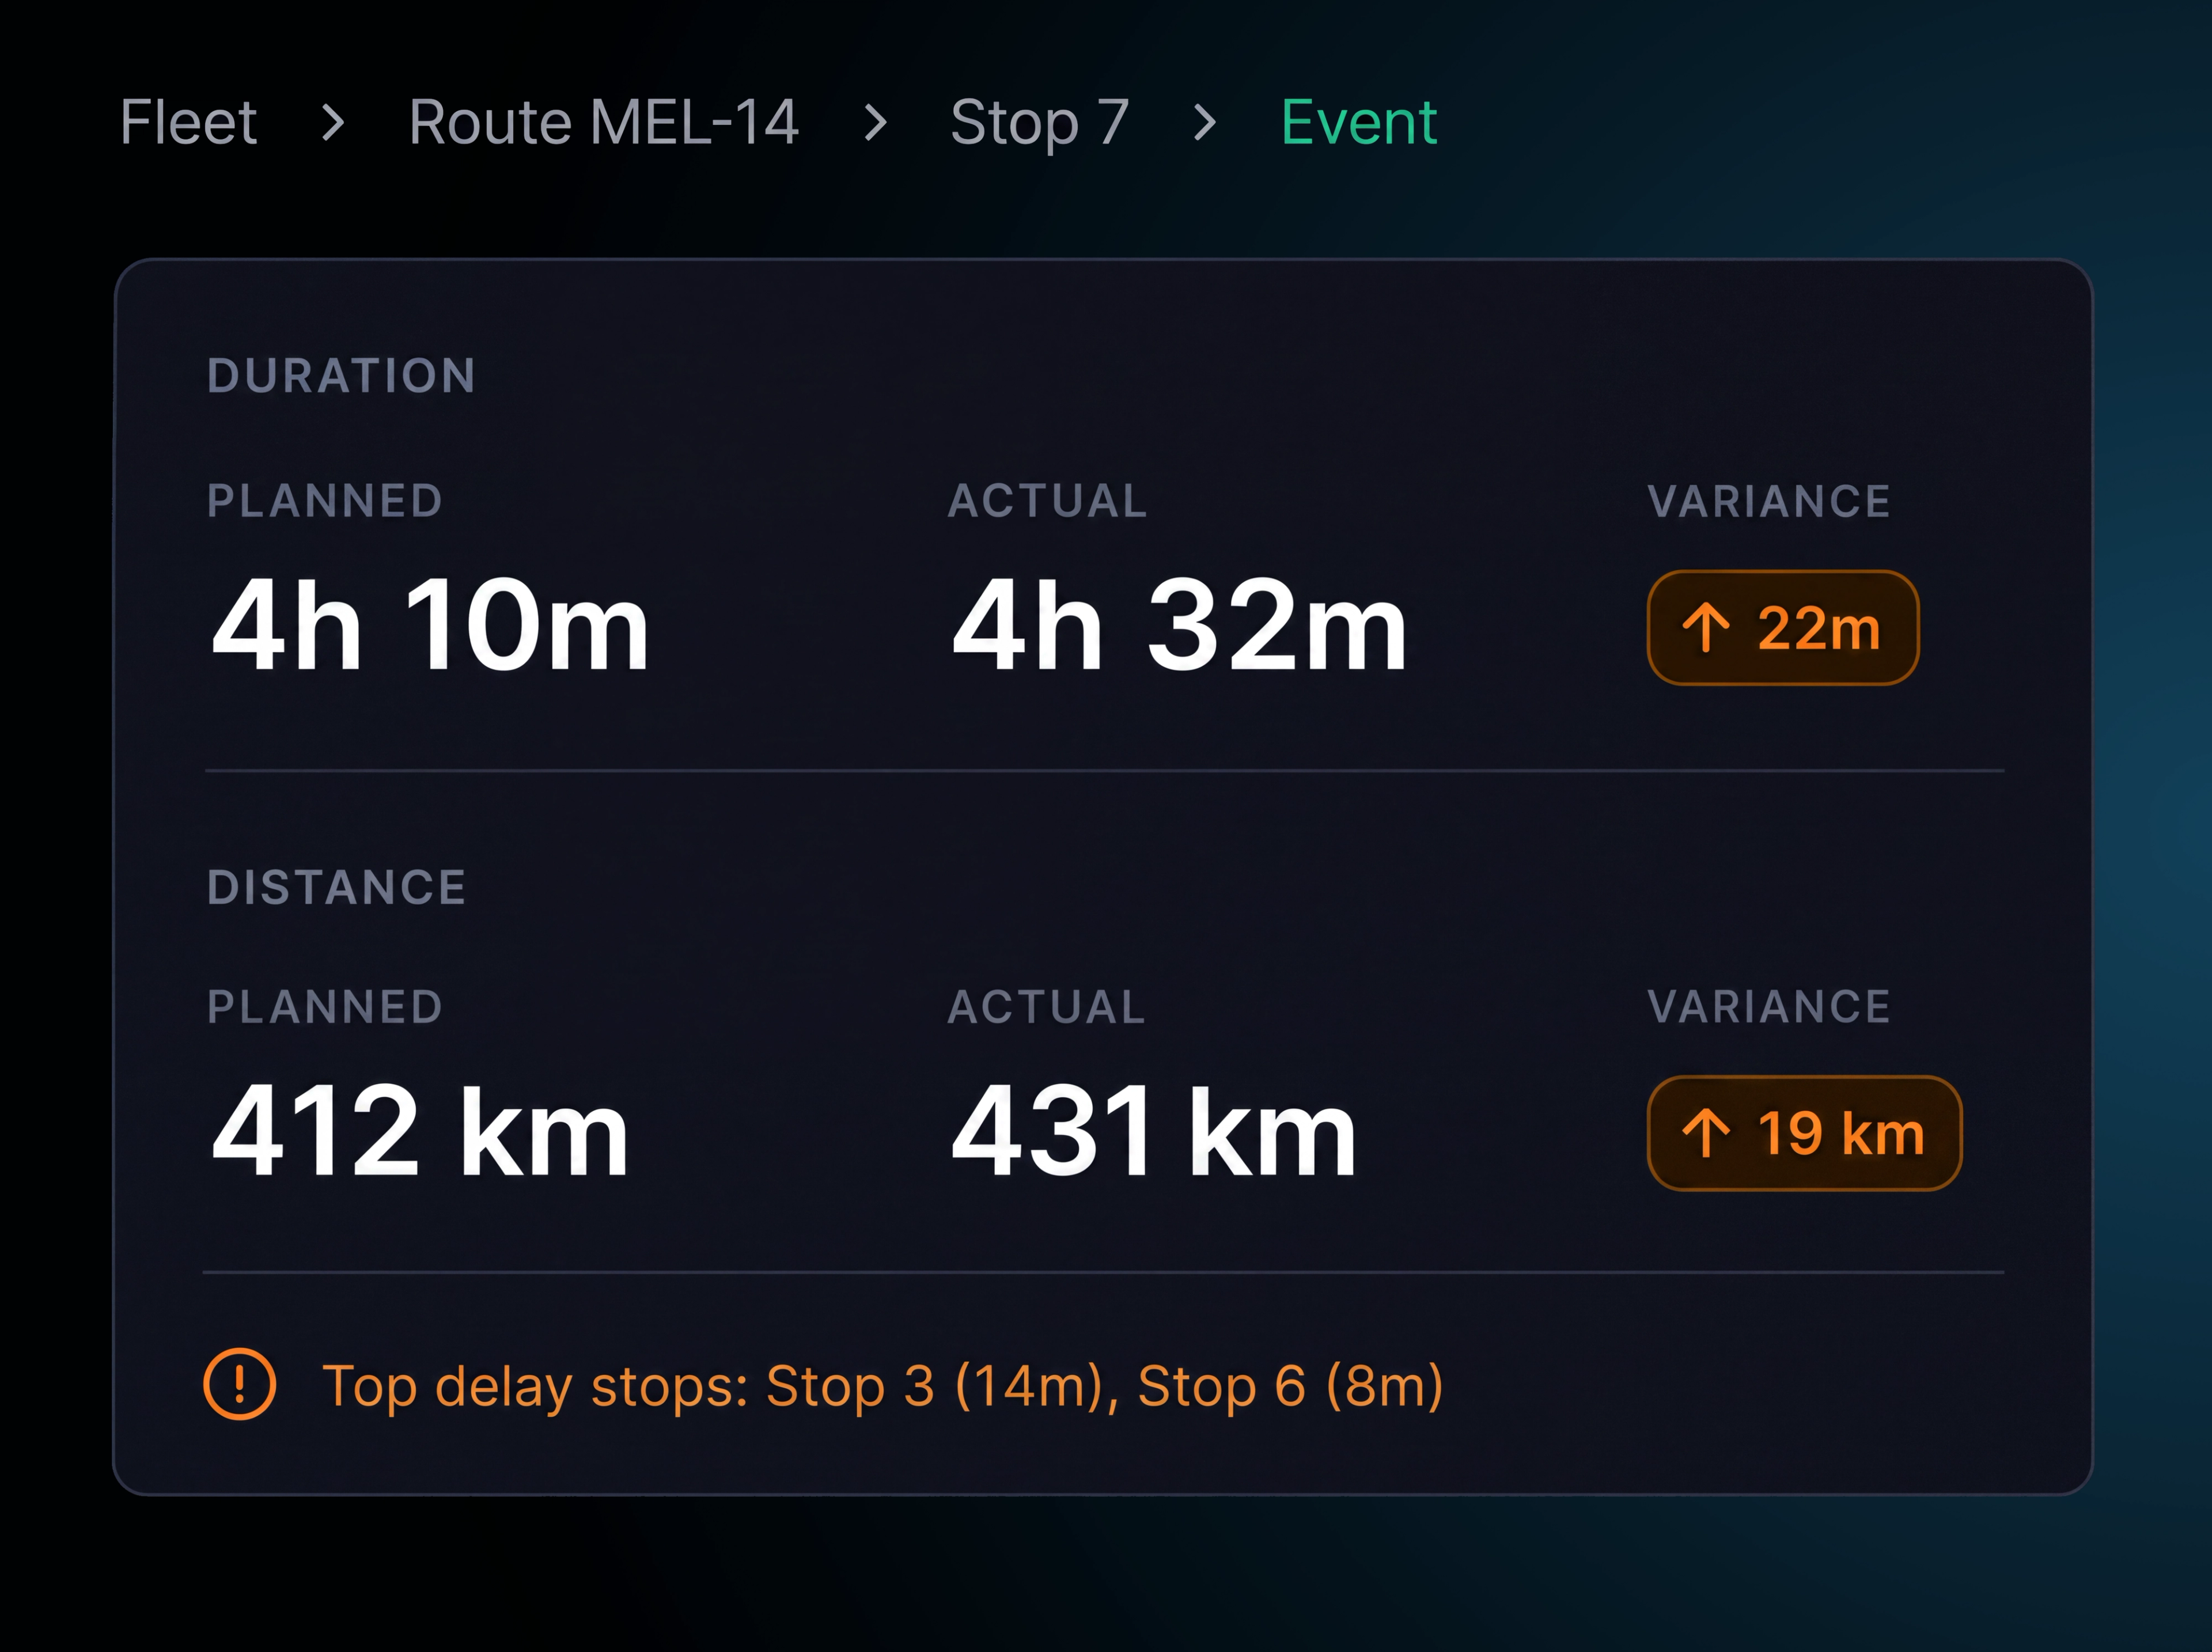
When performance changes, find out where and why. In four clicks, drill from fleet wide performance to the exact route and stop where time was gained or lost, with the relevant exceptions shown in context.
- 1
Fleet overview
All routes and drivers across the selected period.
- 2
Route detail
Compare planned and actual performance for an individual route.
- 3
Stop detail
Identify where time was gained or lost at each stop.
- 4
Event details
Review the timeline and supporting information for an individual event.
Additional features
Period Comparison
Compare any period with another to track changes in performance.
Depot Performance
Compare route performance, on time results and exceptions by depot.
Driver Scorecards
Compare driver performance across routes, stops and key measures.
Delivery Status
Break down stops by completed, failed, rescheduled or cancelled.
Performance Trend
Track how on time and time window performance changes over time.
Saved views
Save commonly used filters for quick access.
Scheduled Reports
Send reports automatically to configured recipients.
Export
Export reports as PDFs for sharing or further review.
Metric Definitions
Define each metric where it appears, so everyone works from the same measure.
Planned vs Actual
Compare planned and actual distance, duration, stop time and wait time.
Delay Hotspots
Identify locations and routes where delays occur repeatedly.
Cost Per Route and Stop
Estimate route and stop costs using your configured inputs.
Frequently Asked Questions
What does Route360 compare planned against?
Actual execution. Distance, duration, stops per route, average stop time and total wait time are shown against the planned figures, including the variance.
How are the metrics defined?
Each metric includes its definition where it appears. On time performance, time window success, ETA deviation, average stop time and total wait time are all measured consistently.
Can I see why a specific route underperformed?
Yes. Drill down from the fleet overview to the route, then to the stop where time was lost and the events behind it, with route exceptions shown alongside.
How is cost calculated?
Cost is estimated from your configured inputs, including labour, vehicle, fuel or energy and tolls. View total cost, cost per route and cost per stop, with the main cost categories broken out.
Can reports be sent automatically?
Yes. Save a filtered view as a report and schedule it for selected recipients at the day and time you choose. Reports are delivered as PDFs.
Turn Route Performance into Better Decisions
Measure today. Understand why. Plan tomorrow better.
- Secure, role based access
- Complete audit trail of every change
- Communication via app, SMS and email
- Available across web and mobile