Performance & Cost Intelligence
Know What’s Performing. Know What It’s Costing. Know where to improve.
Bring people, vehicles, routes, service and cost data together to understand performance, uncover inefficiencies and identify where your operation can improve.
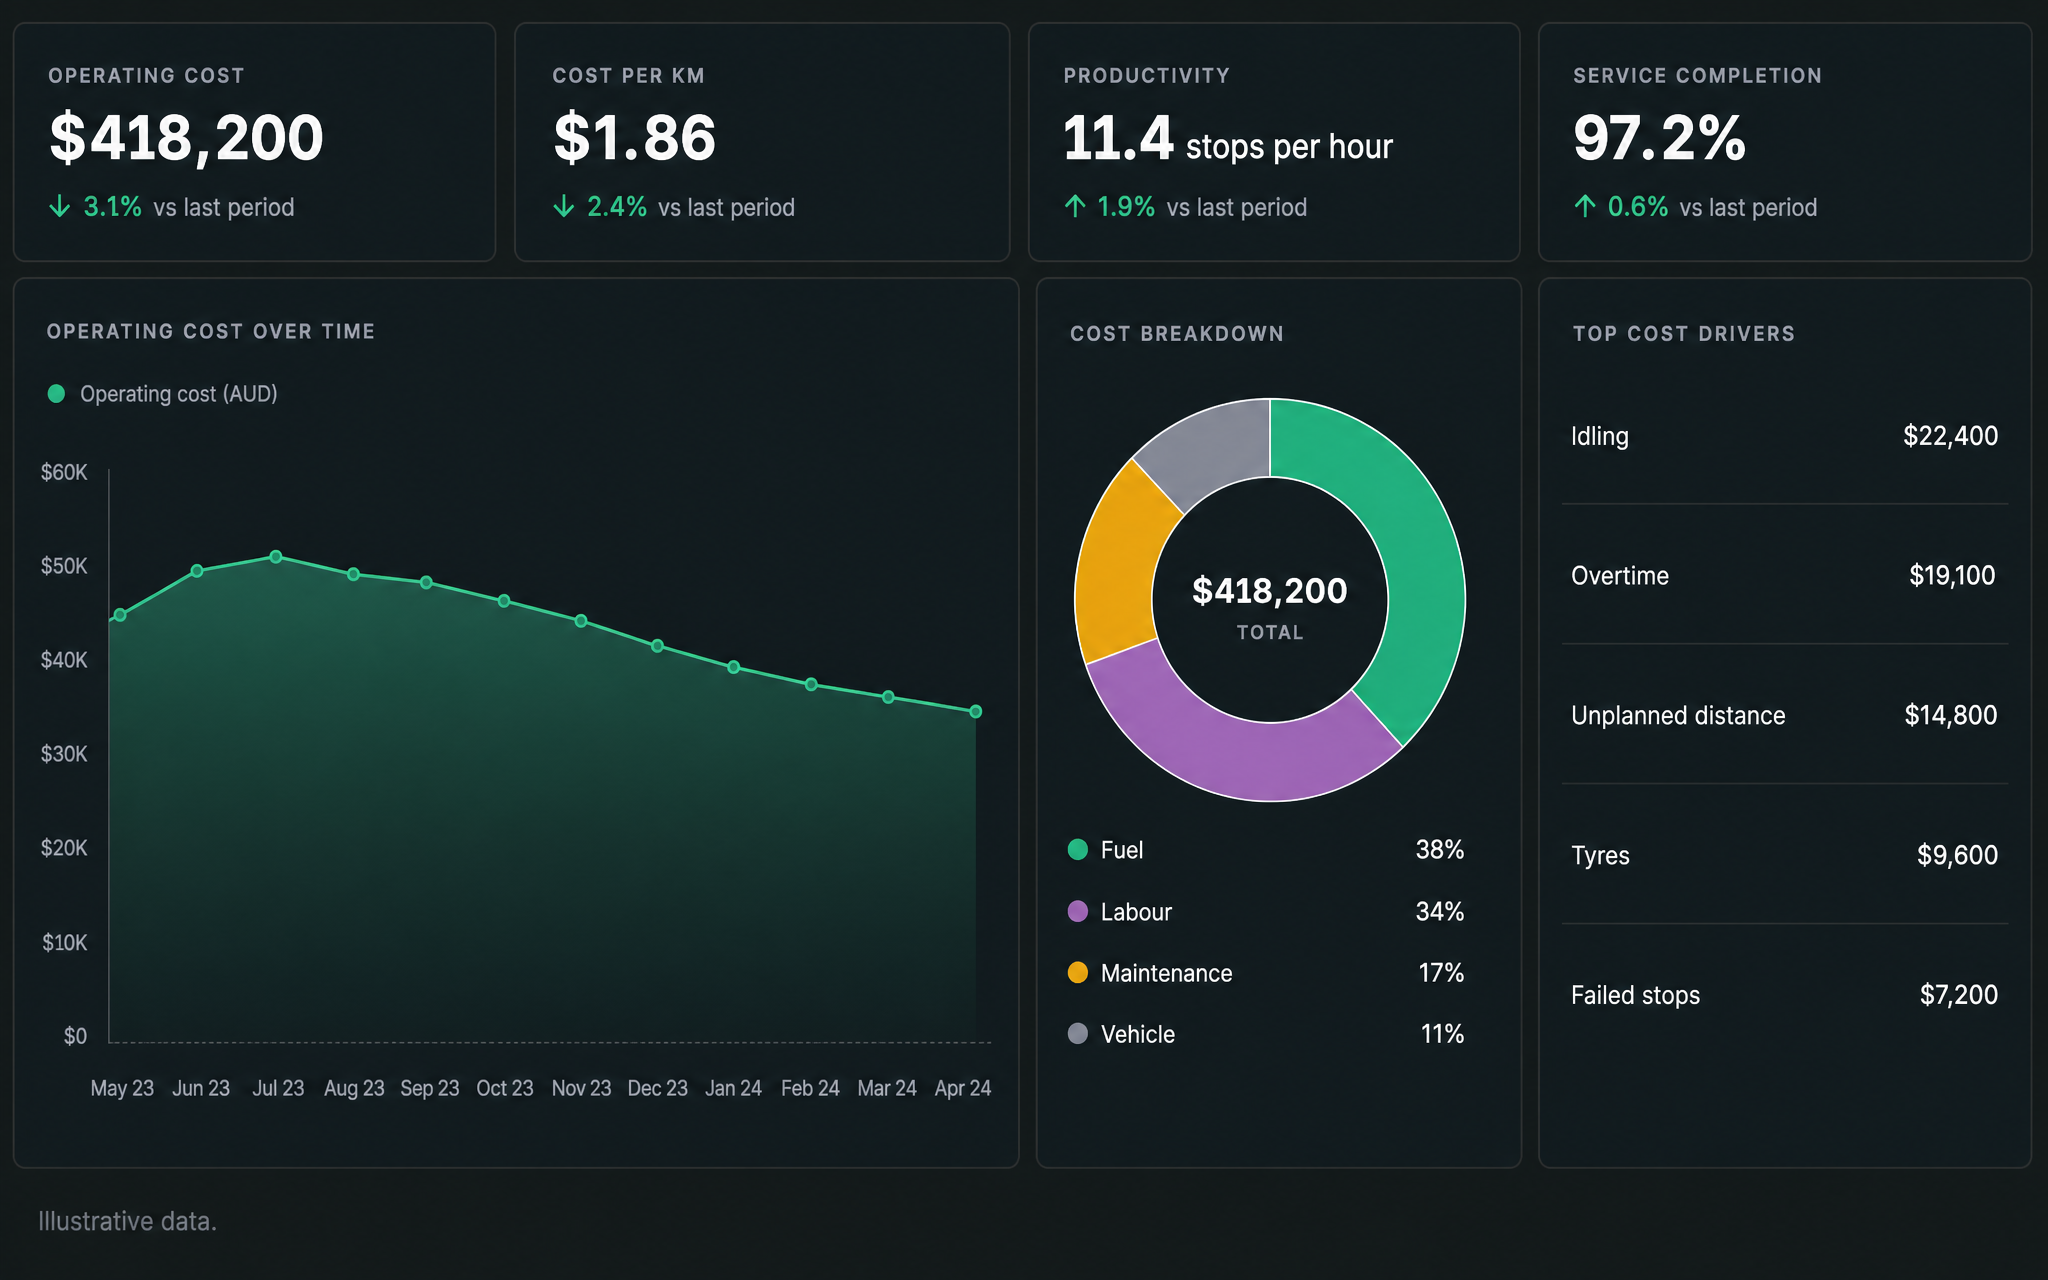
From Operational Data to Better Decisions
Turn the data your operation already creates into a clearer picture of performance, cost and where to improve.
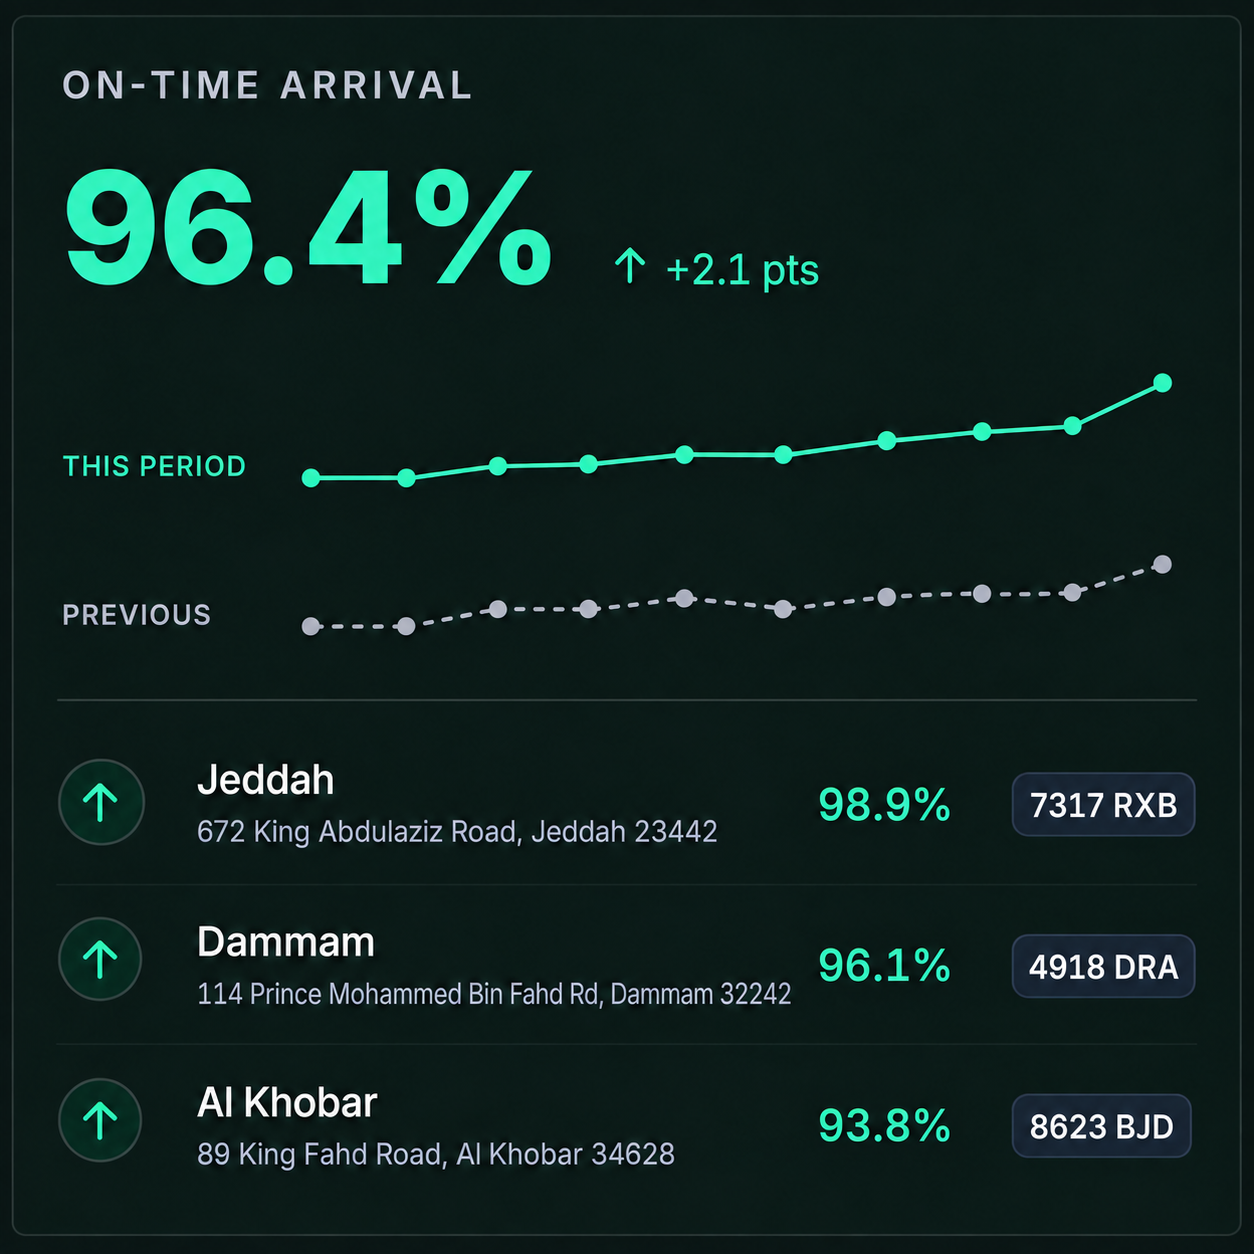
1See What’s Changing
Compare performance over time to understand what has changed, where it is happening and what is having the greatest operational impact.
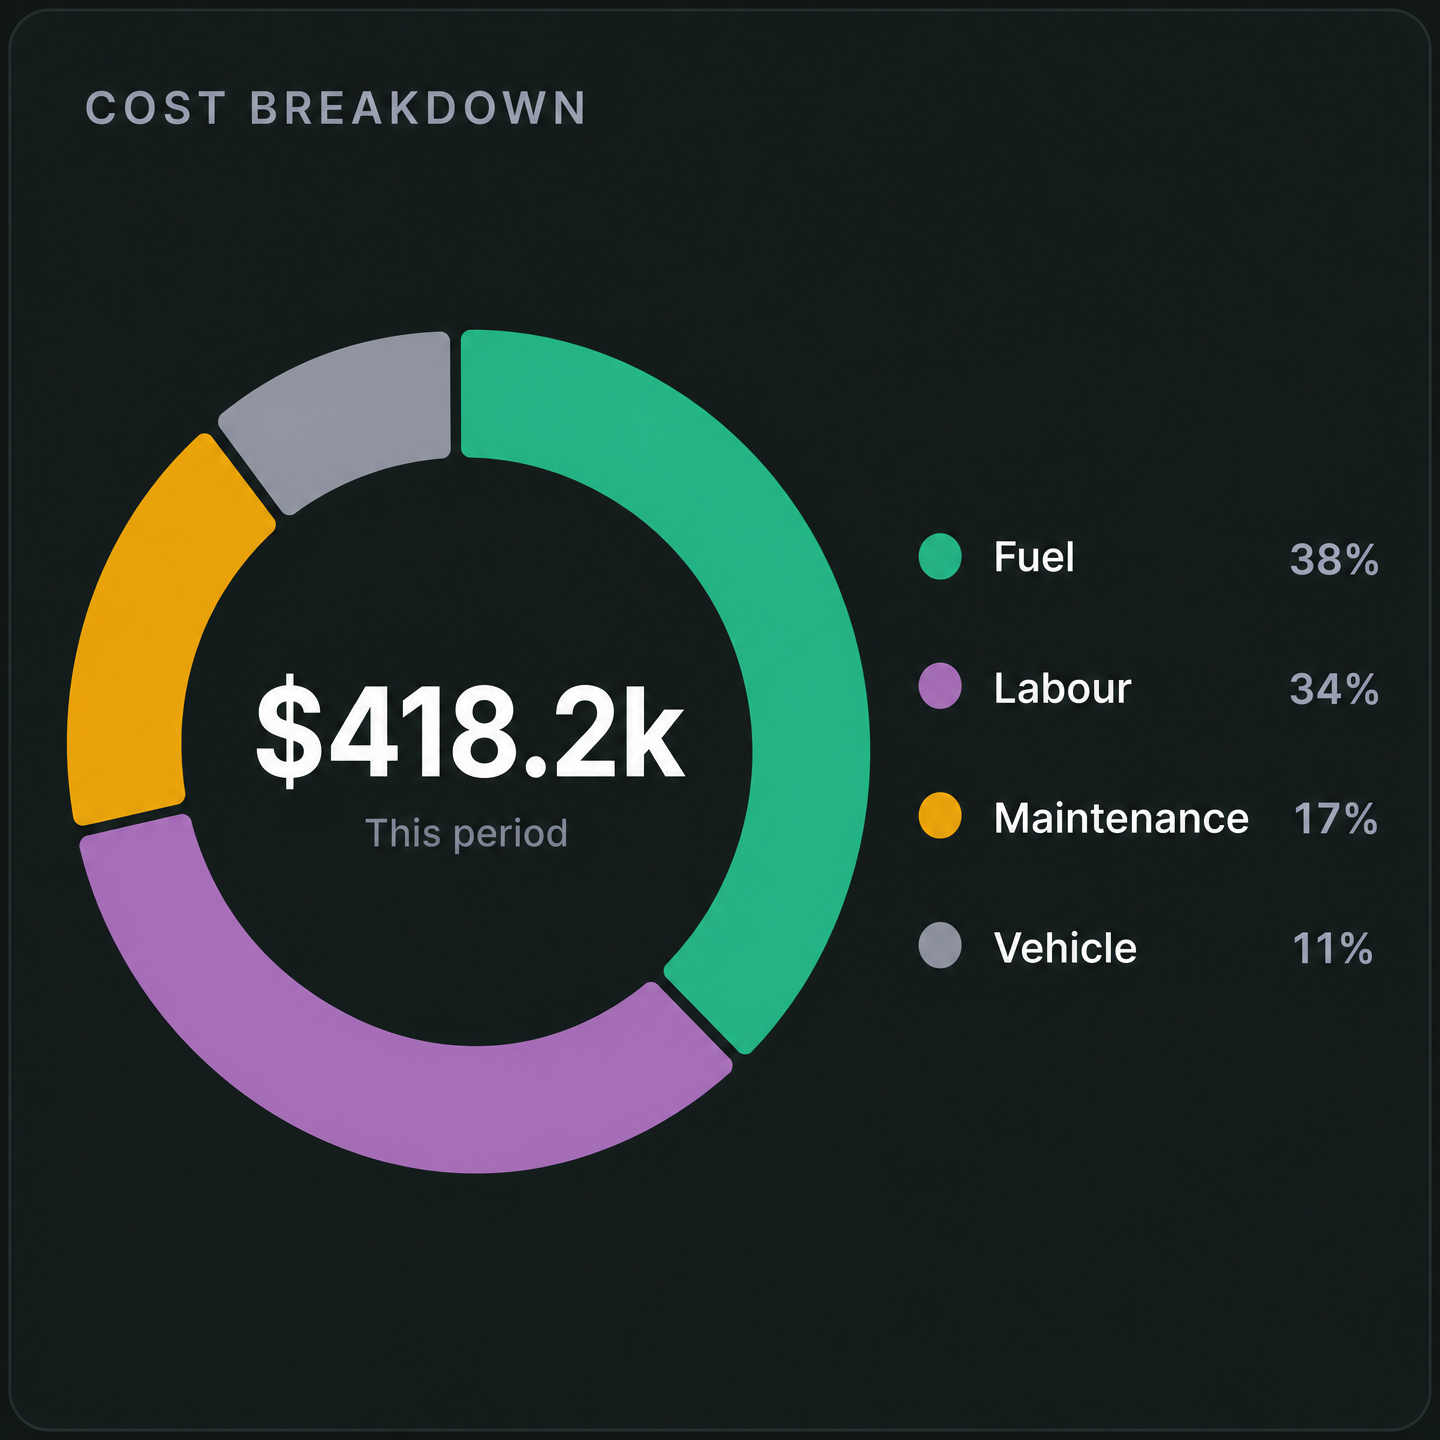
2Understand Your Costs
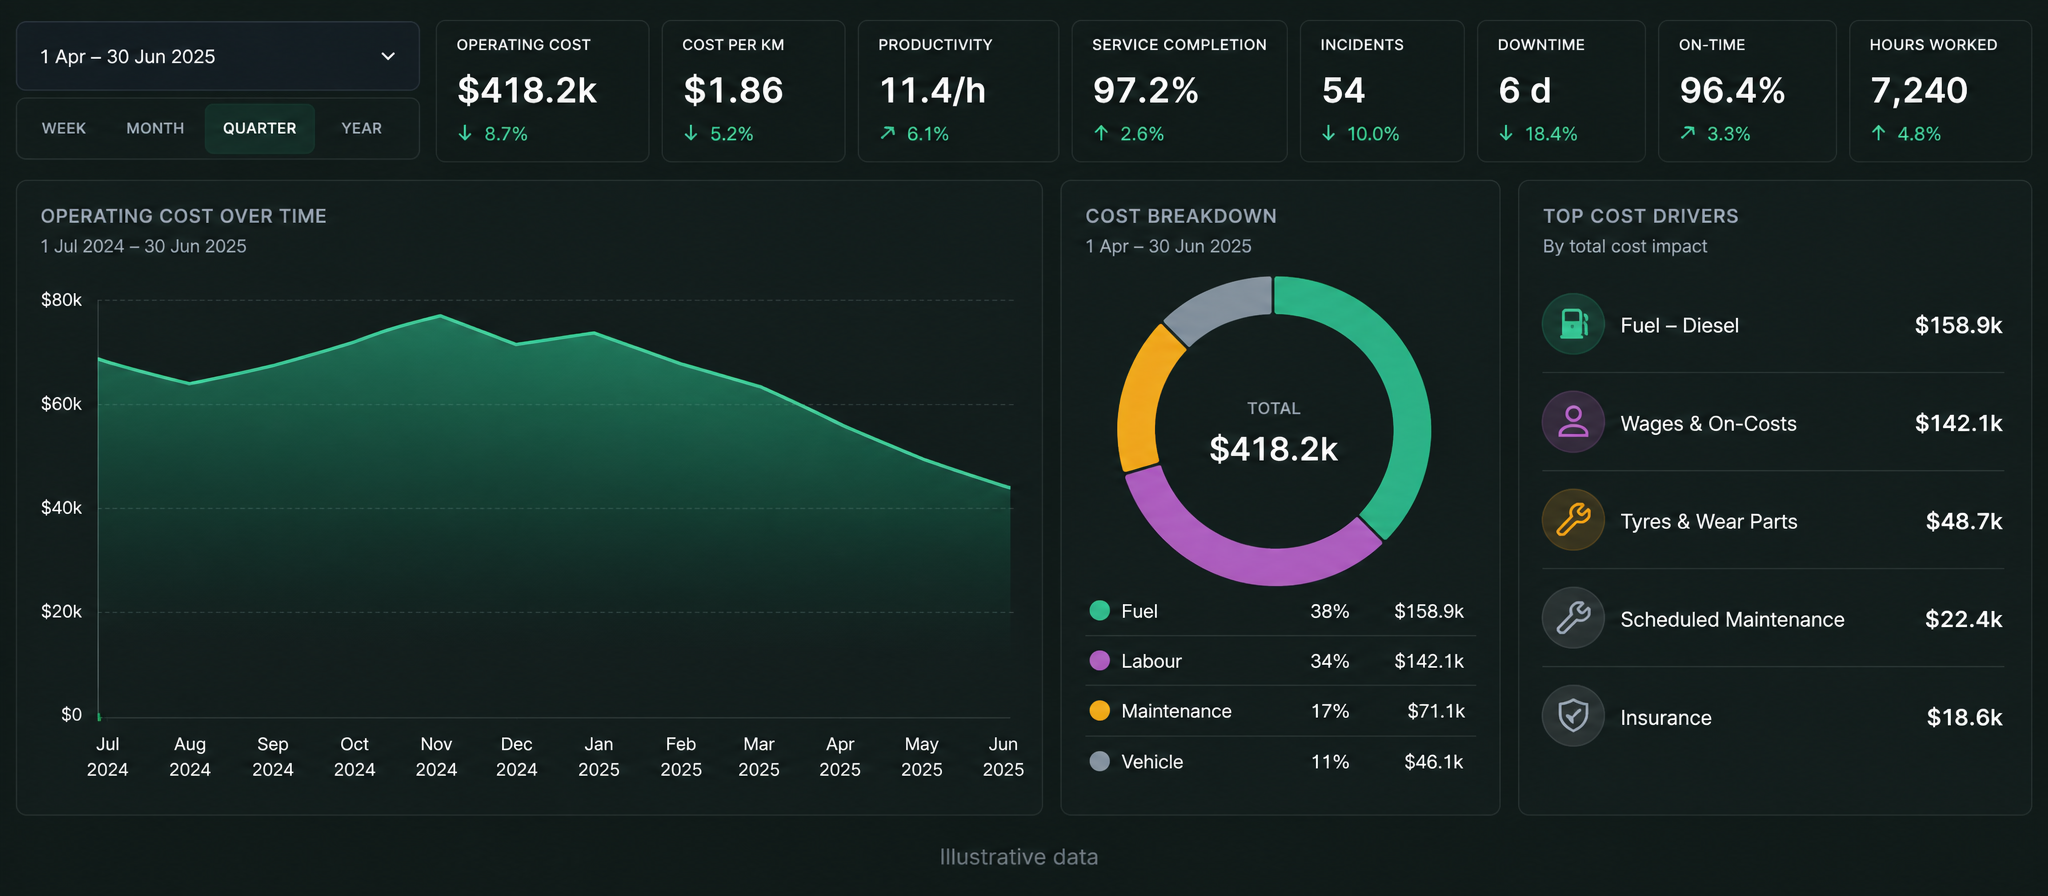
See where money is being spent across fuel, labour, maintenance and vehicles, and identify the inefficiencies driving unnecessary cost.
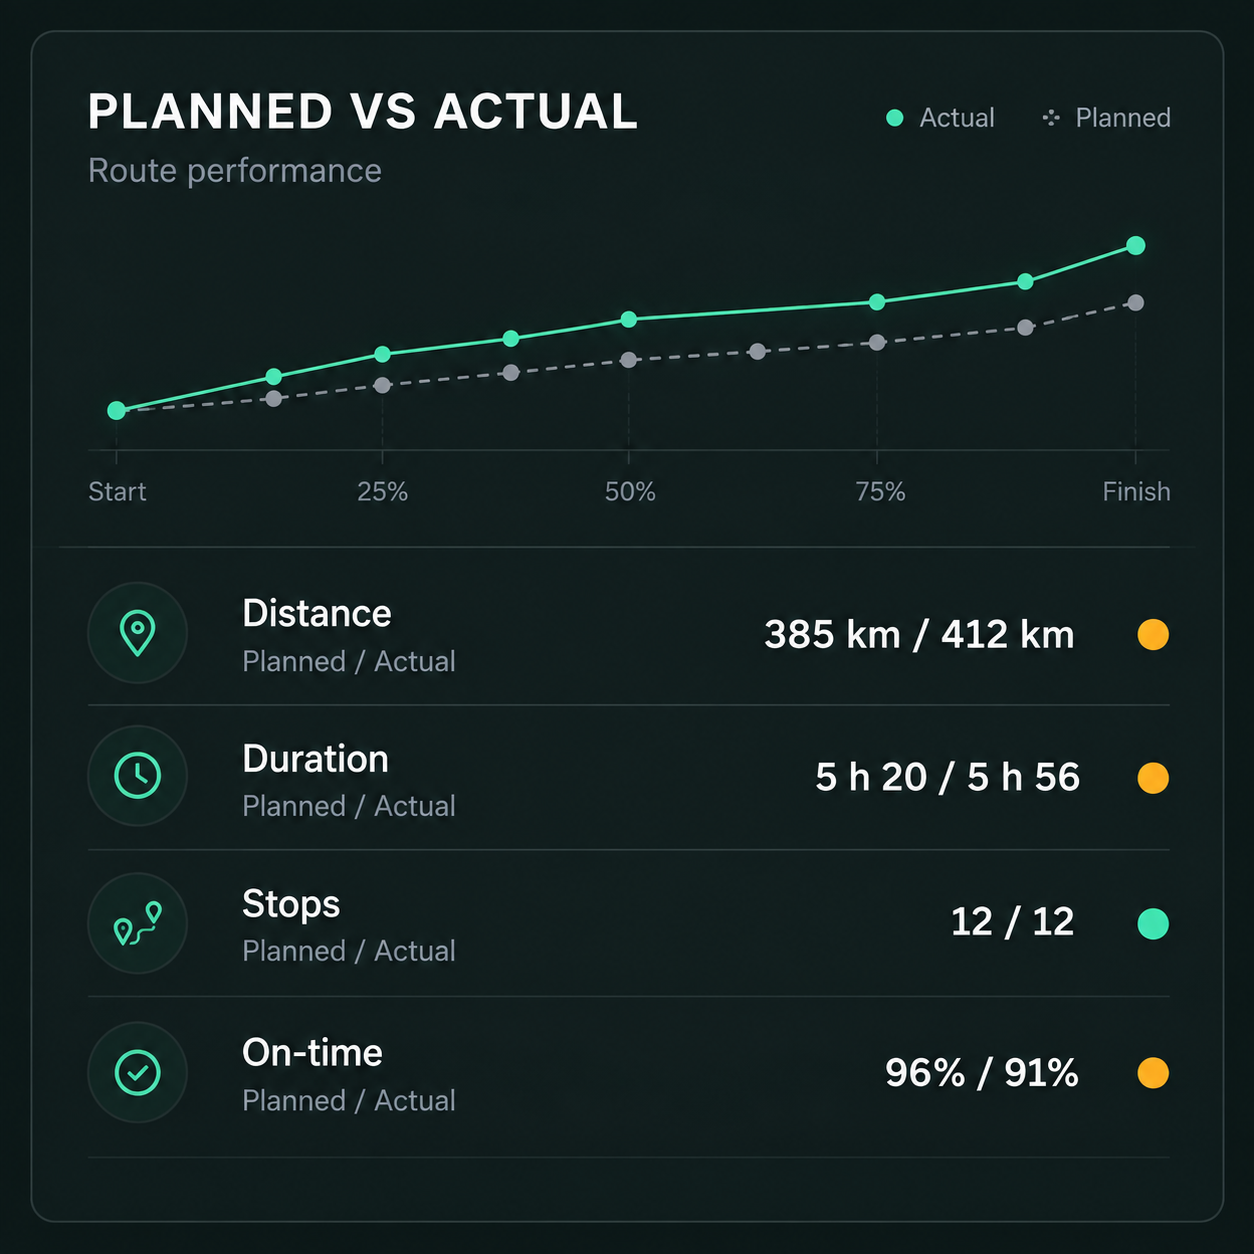
3Improve Performance
Compare planned and actual performance across distance, duration, stops and service to identify where productivity can improve.
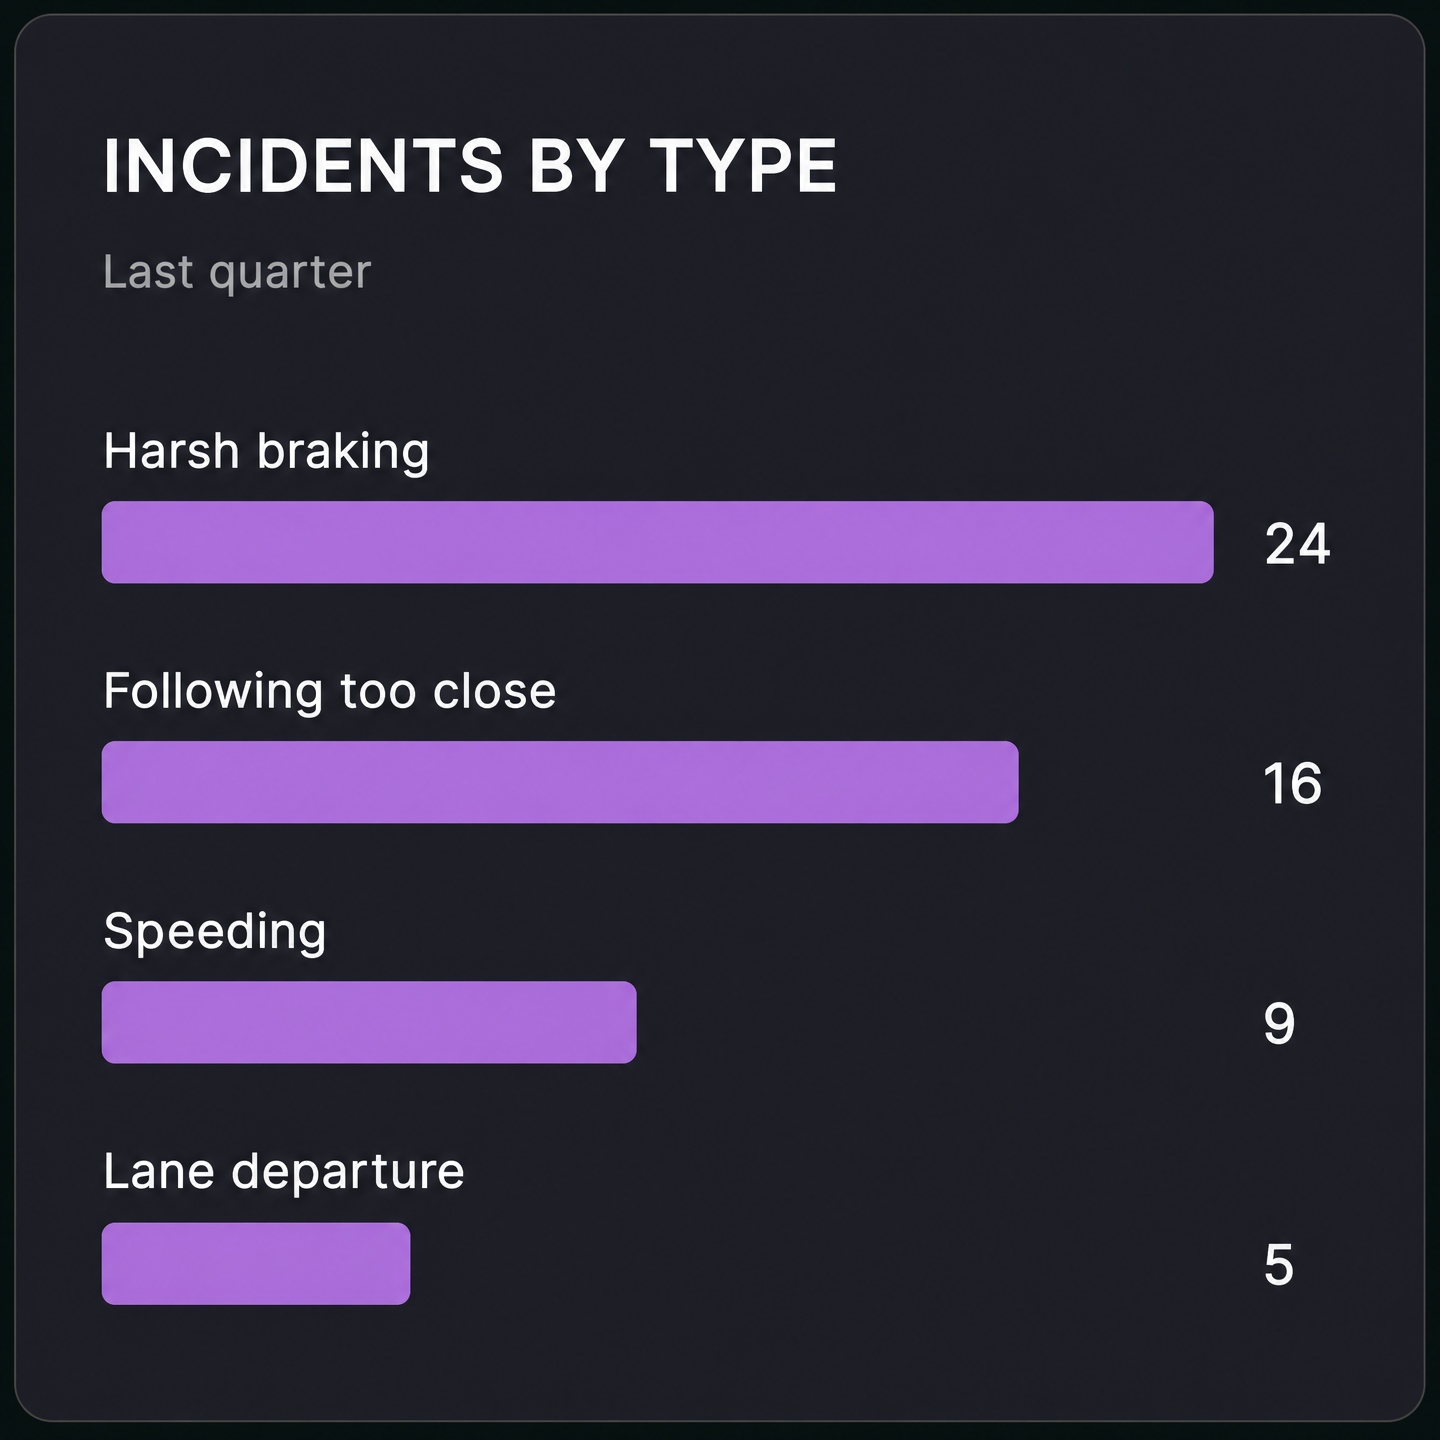
4Identify Recurring Issues
Spot patterns across incidents, exceptions and operational performance so your team can address recurring problems before they become established.
Executive dashboard
The Numbers Behind the Operation
See cost, productivity and service performance together, with the detail behind each change so your team can make informed decisions.
Route and service
Measure Efficiency, Delays and Capacity
Understand how routes and services are performing by tracking duration, distance, capacity utilisation, late stops and incomplete work.

People and Vehicles
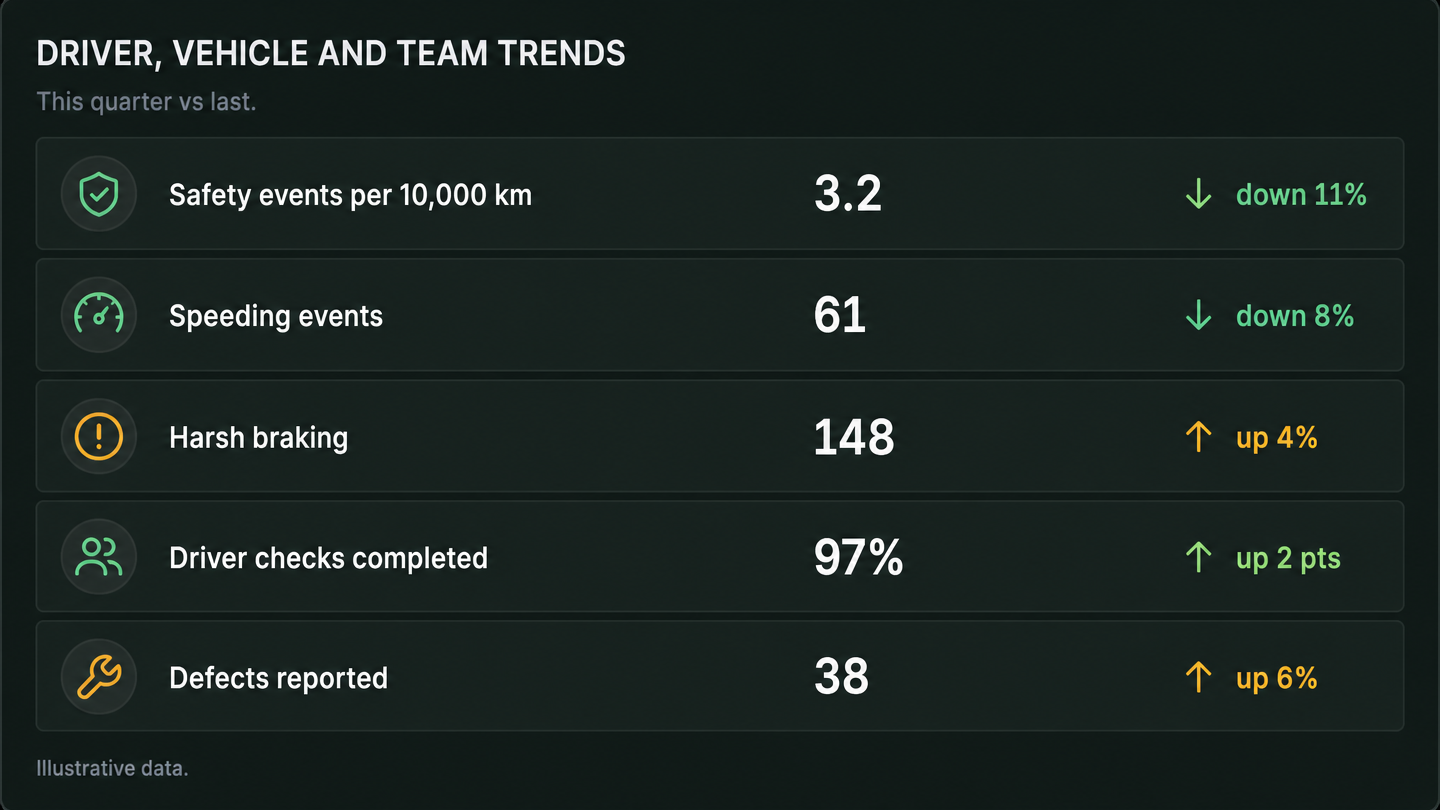
Understand Driver, Vehicle and Team Performance
Track safety events, speeding, harsh braking, driver checks, reported defects and compliance exceptions, with performance trends across people, vehicles and teams.
Availability
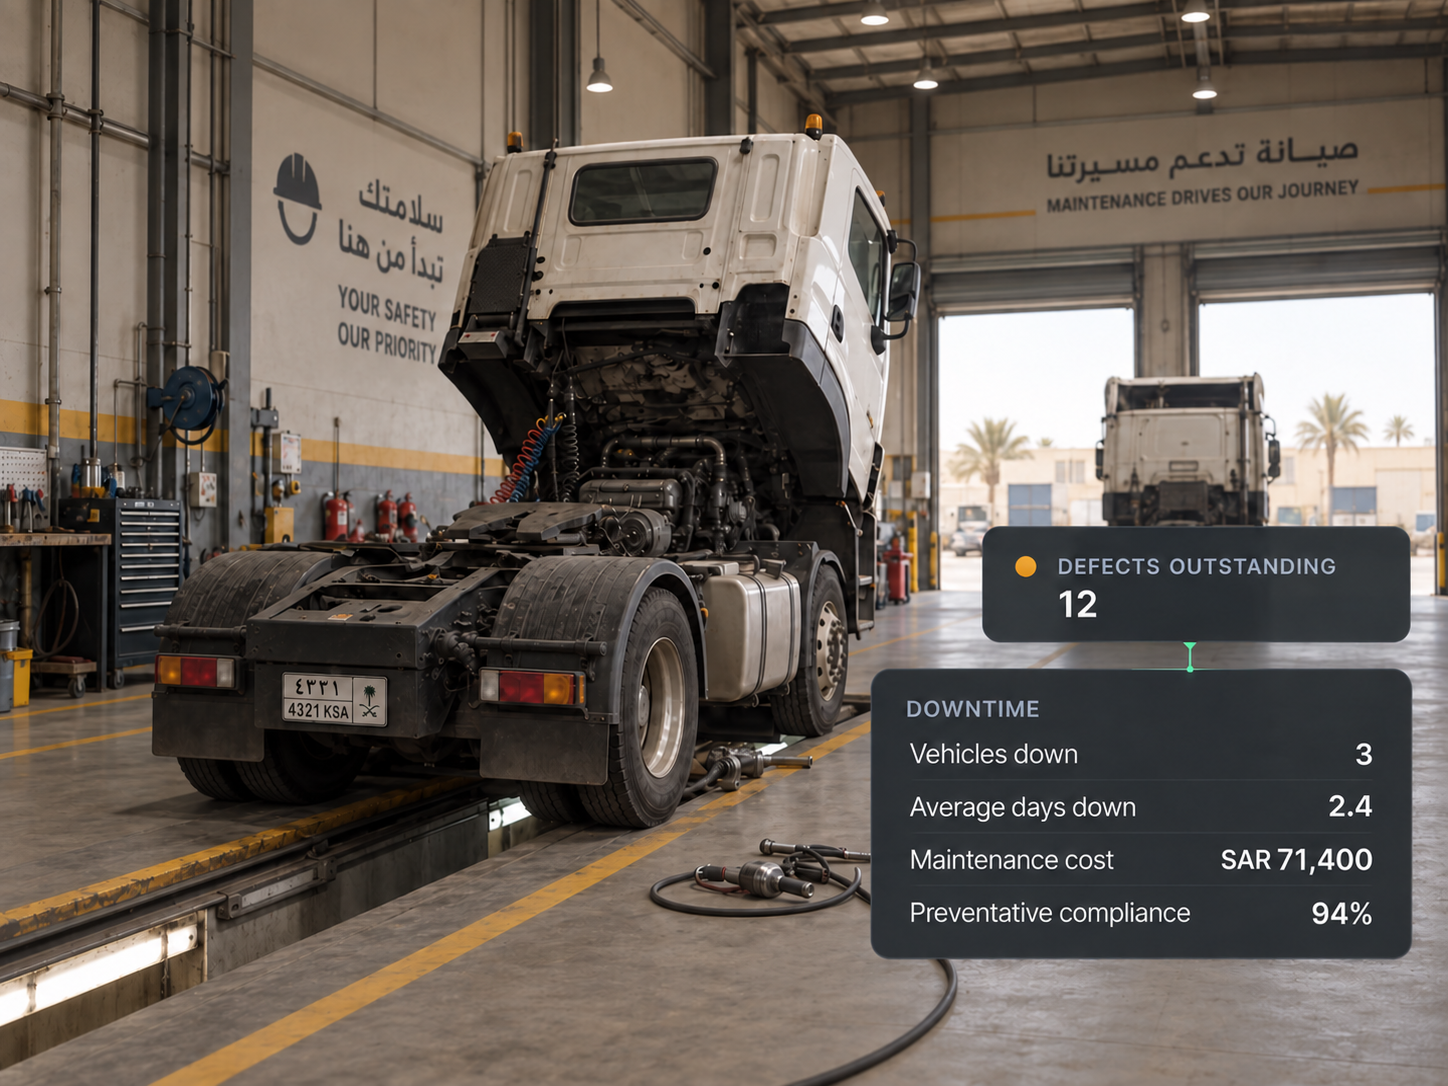
Understand What’s Affecting Availability
Track vehicle downtime, days off road, maintenance costs, outstanding defects and preventative maintenance to understand what is affecting fleet availability.
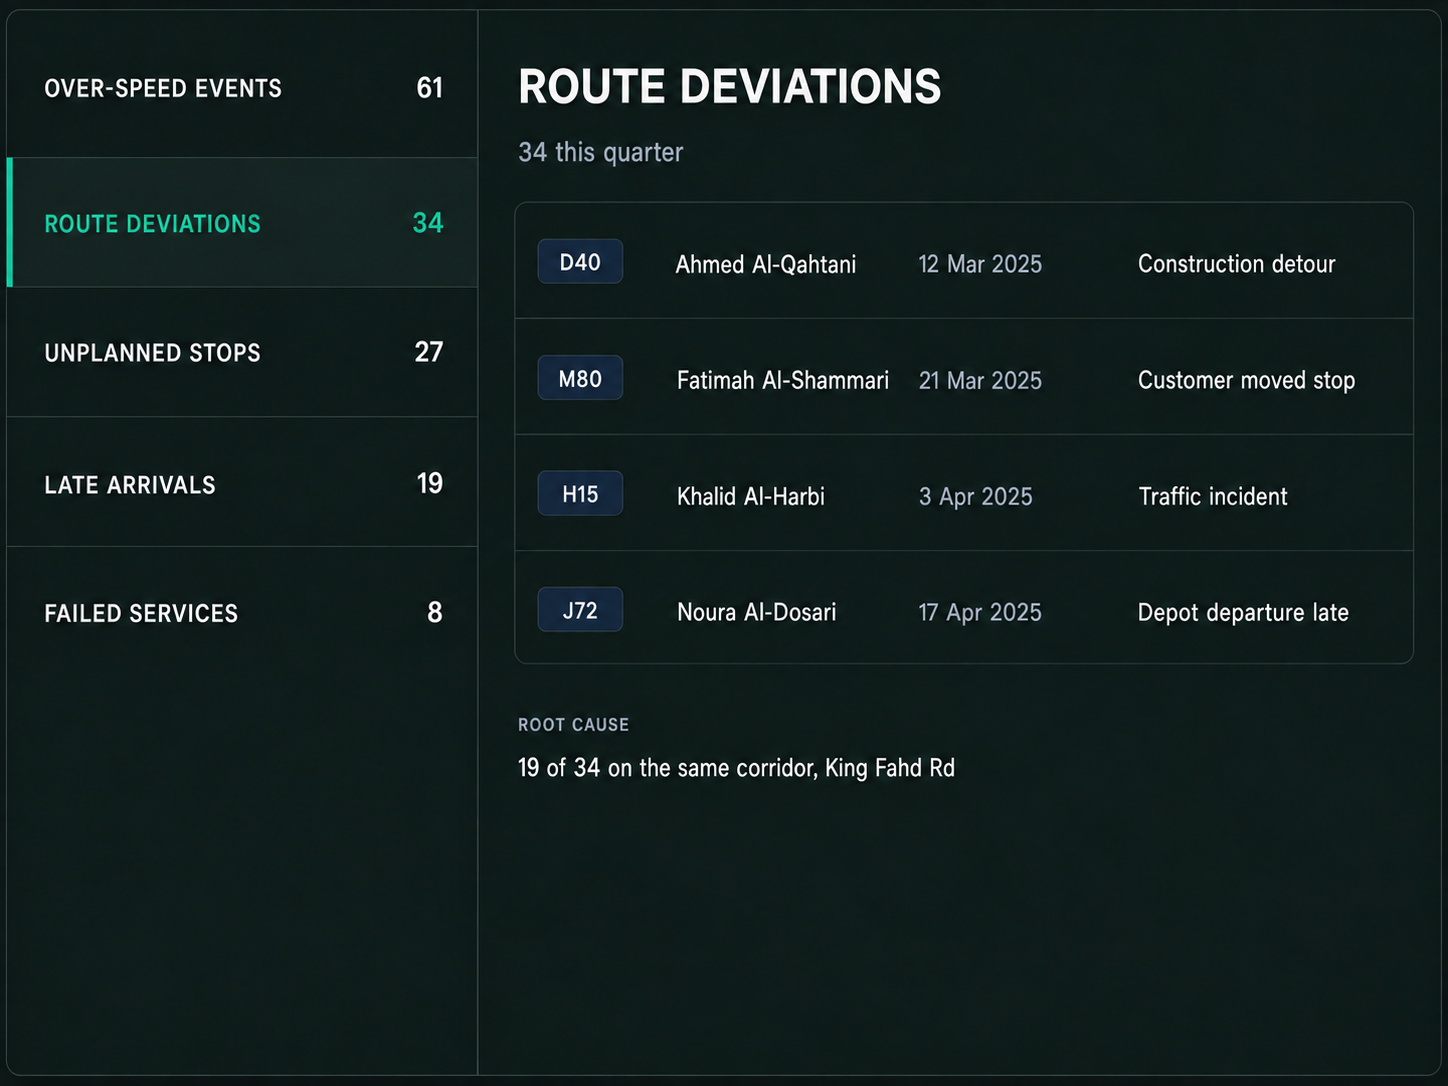
Exceptions
Understand the Exception. See What’s Behind It.
Review speeding events, route deviations, unplanned stops, late arrivals and failed services, with the records behind each exception available for investigation.
Follow up
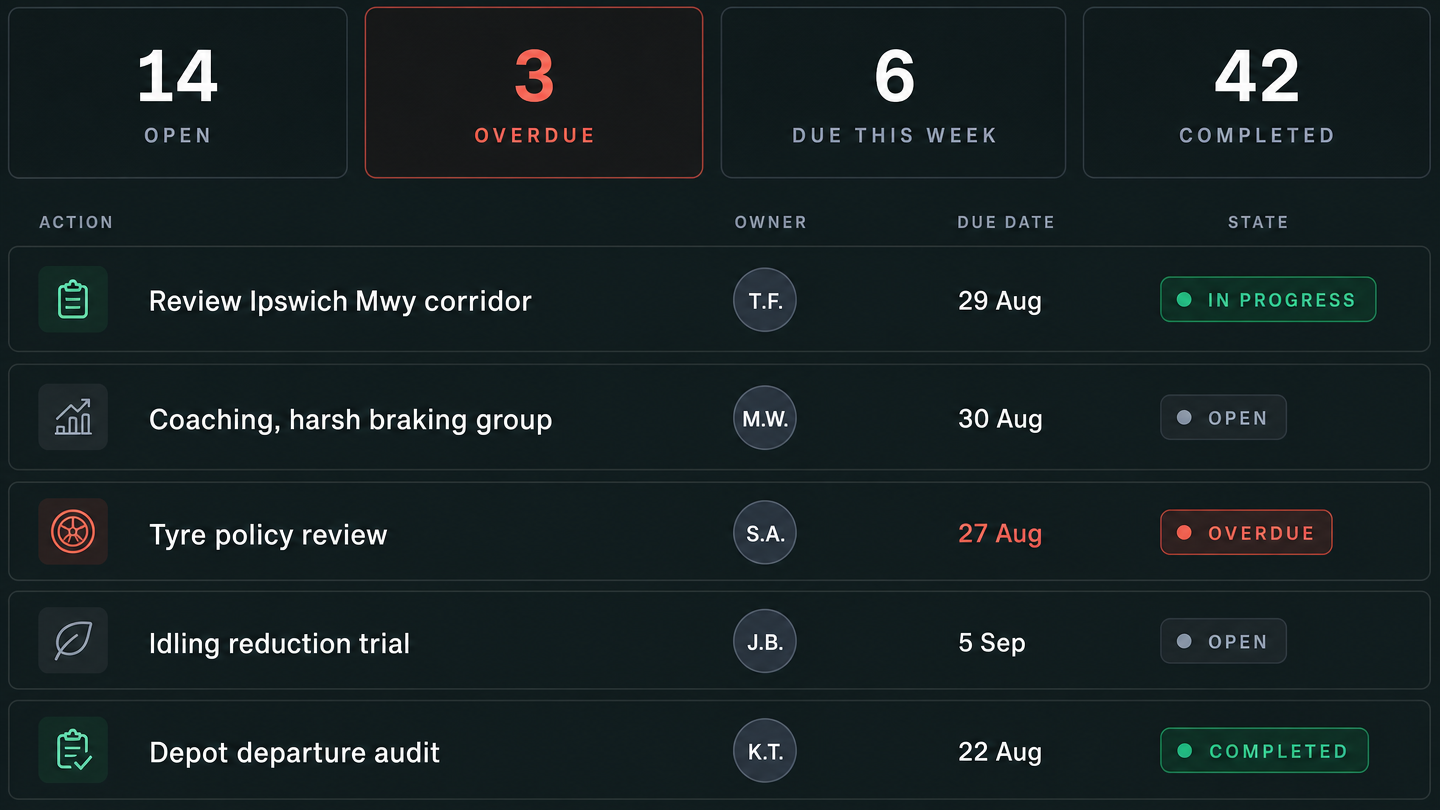
Turn Insight Into Action
Assign actions, set clear ownership and keep open, overdue and completed work visible through to resolution.
Reporting
Put the Right Numbers in the Right Hands
Build dashboards, schedule reports and export operational data so the people making decisions have the information they need.

Connect the Data Behind Your Operation
Sources
Bring Drive360 and Route360 records together with telematics, fuel, maintenance, payroll and other operational data.

Connected Systems
Use secure API connections to bring information together across the systems your operation already relies on.

Controlled Access
Give teams access to the information relevant to their role while keeping sensitive operational data appropriately restricted.

Turn Your Data Into Better Performance
Bring Drive360 and Route360 together to understand performance, control costs and identify where your operation can improve.